PROTECTED SOURCE SCRIPT
업데이트됨 MTF RSI Grid with MFI [checkm8]
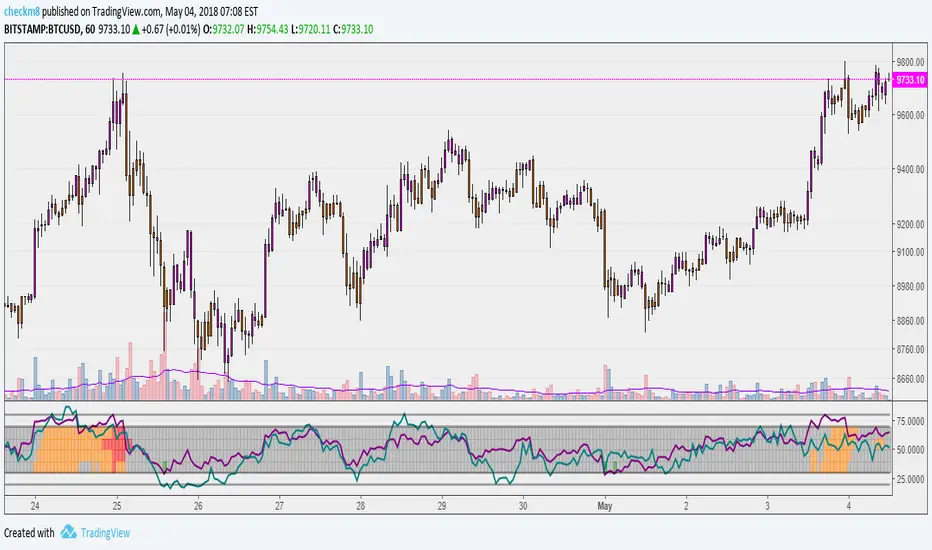
Hello and welcome to my version of the multi-timeframe RSI grid, with MFI.
This oscillator is relatively simple and plots four sets of timeframes (selected by the user) within the levels between 30 and 70. In addition to this, it plots the RSI from the current timeframe, as well as the MFI.
As per the default settings:
1) The grid will show lime-colored blocks when the RSI is below 20 and green blocks when RSI is below 30.
2) The grid will show red-colored blocks when RSI is above 80 and orange blocks when RSI is above 70.
3) The initial MTF setup is set to 1 Hour, 2 Hour, 3 Hour, and 4 Hour timeframes. You can adjust this to your preference in the oscillator settings.
4) The purple line is RSI, the teal line is MFI.
Note: the grid only displays RSI values, not MFI.
Happy trading!
릴리즈 노트
Fix for MTF grid (re: TradingView columns visual update)보호된 스크립트입니다
이 스크립트는 비공개 소스로 게시됩니다. 하지만 이를 자유롭게 제한 없이 사용할 수 있습니다 – 자세한 내용은 여기에서 확인하세요.
면책사항
해당 정보와 게시물은 금융, 투자, 트레이딩 또는 기타 유형의 조언이나 권장 사항으로 간주되지 않으며, 트레이딩뷰에서 제공하거나 보증하는 것이 아닙니다. 자세한 내용은 이용 약관을 참조하세요.
면책사항
해당 정보와 게시물은 금융, 투자, 트레이딩 또는 기타 유형의 조언이나 권장 사항으로 간주되지 않으며, 트레이딩뷰에서 제공하거나 보증하는 것이 아닙니다. 자세한 내용은 이용 약관을 참조하세요.