PROTECTED SOURCE SCRIPT
Katsu mtf RSI Cloud
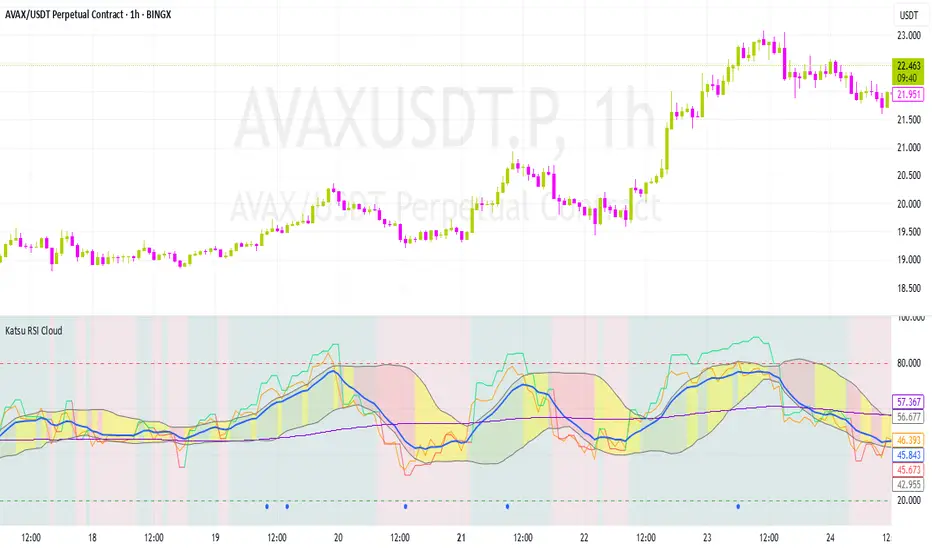
Katsu MTF RSI and Cloud
Multi-timeframe RSI-based analytical tool for advanced traders
The Katsu MTF RSI is a sophisticated indicator that combines two RSI signals from different timeframes into one powerful toolkit. It’s perfect for those looking for multi-timeframe confluence to make more precise trading decisions.
Key Features:
Dual RSI Setup (fully customizable timeframe and length):
The first RSI behaves in a traditional way.
The second RSI uses color-coding to visually indicate the dominant trend direction:
🟢 Green = Bullish, 🔴 Red = Bearish.
RSI EMA – Smoothed RSI Average:
Used to determine short-term direction. This moving average is essential for crafting entries and forming your overall trading strategy.
Dynamic Midline – Adaptive Overbought/Oversold Levels:
The overbought/oversold zones are not fixed (like 70/30), but are dynamically adjusted based on the RSI’s average behavior.
When RSI touches these adaptive levels, a small blue arrow appears, signaling a potential momentum shift.
This provides more precise signals than traditional static thresholds (e.g., 70/30 or 80/20).
RSI-Based Cloud Visualization:
The RSI is used to generate a visual cloud that reflects market structure:
When RSI breaks out above the cloud, followed by RSI2, it can signal a strong entry point.
When RSI enters the cloud and reverses, it may indicate a potential exit or reversal zone.
The cloud uses three distinct colors to represent momentum:
Visual Momentum Feedback (Background Highlight):
The background color shifts to indicate whether RSI is moving above or below 50, giving a quick read on bullish or bearish momentum.
This indicator is especially powerful for multi-timeframe strategies where entries are made on a lower timeframe, but confirmation comes from a higher one. It provides a dynamic, visual framework to stay in sync with the market’s rhythm.
Multi-timeframe RSI-based analytical tool for advanced traders
The Katsu MTF RSI is a sophisticated indicator that combines two RSI signals from different timeframes into one powerful toolkit. It’s perfect for those looking for multi-timeframe confluence to make more precise trading decisions.
Key Features:
Dual RSI Setup (fully customizable timeframe and length):
The first RSI behaves in a traditional way.
The second RSI uses color-coding to visually indicate the dominant trend direction:
🟢 Green = Bullish, 🔴 Red = Bearish.
RSI EMA – Smoothed RSI Average:
Used to determine short-term direction. This moving average is essential for crafting entries and forming your overall trading strategy.
Dynamic Midline – Adaptive Overbought/Oversold Levels:
The overbought/oversold zones are not fixed (like 70/30), but are dynamically adjusted based on the RSI’s average behavior.
When RSI touches these adaptive levels, a small blue arrow appears, signaling a potential momentum shift.
This provides more precise signals than traditional static thresholds (e.g., 70/30 or 80/20).
RSI-Based Cloud Visualization:
The RSI is used to generate a visual cloud that reflects market structure:
When RSI breaks out above the cloud, followed by RSI2, it can signal a strong entry point.
When RSI enters the cloud and reverses, it may indicate a potential exit or reversal zone.
The cloud uses three distinct colors to represent momentum:
- Green: RSI is above the cloud → Strong bullish pressure, price well above the trend zone.
- Red: RSI is below the cloud → Strong bearish pressure, price well below the trend zone.
- Yellow: RSI is inside the cloud → Sideways or corrective move, often a potential exit zone, as the trend may be stalling.
Visual Momentum Feedback (Background Highlight):
The background color shifts to indicate whether RSI is moving above or below 50, giving a quick read on bullish or bearish momentum.
This indicator is especially powerful for multi-timeframe strategies where entries are made on a lower timeframe, but confirmation comes from a higher one. It provides a dynamic, visual framework to stay in sync with the market’s rhythm.
보호된 스크립트입니다
이 스크립트는 비공개 소스로 게시됩니다. 하지만 이를 자유롭게 제한 없이 사용할 수 있습니다 – 자세한 내용은 여기에서 확인하세요.
Magyar Discord Szerver -> Link Tagsághoz: whop.com/kriptoarenayt/
면책사항
해당 정보와 게시물은 금융, 투자, 트레이딩 또는 기타 유형의 조언이나 권장 사항으로 간주되지 않으며, 트레이딩뷰에서 제공하거나 보증하는 것이 아닙니다. 자세한 내용은 이용 약관을 참조하세요.
보호된 스크립트입니다
이 스크립트는 비공개 소스로 게시됩니다. 하지만 이를 자유롭게 제한 없이 사용할 수 있습니다 – 자세한 내용은 여기에서 확인하세요.
Magyar Discord Szerver -> Link Tagsághoz: whop.com/kriptoarenayt/
면책사항
해당 정보와 게시물은 금융, 투자, 트레이딩 또는 기타 유형의 조언이나 권장 사항으로 간주되지 않으며, 트레이딩뷰에서 제공하거나 보증하는 것이 아닙니다. 자세한 내용은 이용 약관을 참조하세요.