OPEN-SOURCE SCRIPT
업데이트됨 Seasonality

This is my attempt to bring an open source Seasonality indicator to TradingView.
There are still outstanding issues I couldn't figure out, so I am hoping some more seasoned Pine Script coders can take the lead from here.
What is Seasonality: https://www.investopedia.com/terms/s/seasonality.asp
How to Use
Known Issues
Areas for Improvement
There are still outstanding issues I couldn't figure out, so I am hoping some more seasoned Pine Script coders can take the lead from here.
What is Seasonality: https://www.investopedia.com/terms/s/seasonality.asp
How to Use
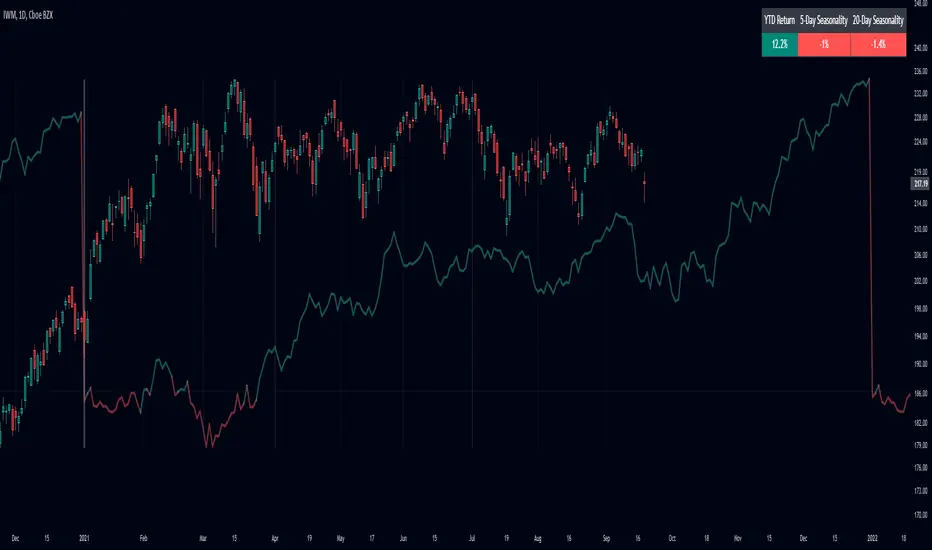
- The indicator plots the avg % change per bar for all complete years, up to 20 years back.
- It will only show in the daily resolution.
- For charts with more data, you need to scroll back a bit to get the line to display.
- Use Offset Adjust in the menu for charts that do not align perfectly to the start of the year.
- Use Smoothing in the menu to apply an EMA to the line.
- The panel shows YTD % gain, 5-day rolling seasonality, and 20-day rolling seasonality.
Known Issues
- Does not work for tickers with over 10,000 bars of data.
- Some tickers do not align correctly.
- Only works with tickers that have ~252 bars a year.
Areas for Improvement
- Figure out a way to use barssince() to get the precise amount of bars for each year. This will make the seasonality calculation and automatic offset more accurate.
- Have an option for calendar week, month, and year seasonality.
릴리즈 노트
Cleaned up the script.릴리즈 노트
Cleaned up the code some more so it is easier to read.오픈 소스 스크립트
트레이딩뷰의 진정한 정신에 따라, 이 스크립트의 작성자는 이를 오픈소스로 공개하여 트레이더들이 기능을 검토하고 검증할 수 있도록 했습니다. 작성자에게 찬사를 보냅니다! 이 코드는 무료로 사용할 수 있지만, 코드를 재게시하는 경우 하우스 룰이 적용된다는 점을 기억하세요.
면책사항
해당 정보와 게시물은 금융, 투자, 트레이딩 또는 기타 유형의 조언이나 권장 사항으로 간주되지 않으며, 트레이딩뷰에서 제공하거나 보증하는 것이 아닙니다. 자세한 내용은 이용 약관을 참조하세요.
오픈 소스 스크립트
트레이딩뷰의 진정한 정신에 따라, 이 스크립트의 작성자는 이를 오픈소스로 공개하여 트레이더들이 기능을 검토하고 검증할 수 있도록 했습니다. 작성자에게 찬사를 보냅니다! 이 코드는 무료로 사용할 수 있지만, 코드를 재게시하는 경우 하우스 룰이 적용된다는 점을 기억하세요.
면책사항
해당 정보와 게시물은 금융, 투자, 트레이딩 또는 기타 유형의 조언이나 권장 사항으로 간주되지 않으며, 트레이딩뷰에서 제공하거나 보증하는 것이 아닙니다. 자세한 내용은 이용 약관을 참조하세요.