OPEN-SOURCE SCRIPT
Uwen FX: UWEN Strategy
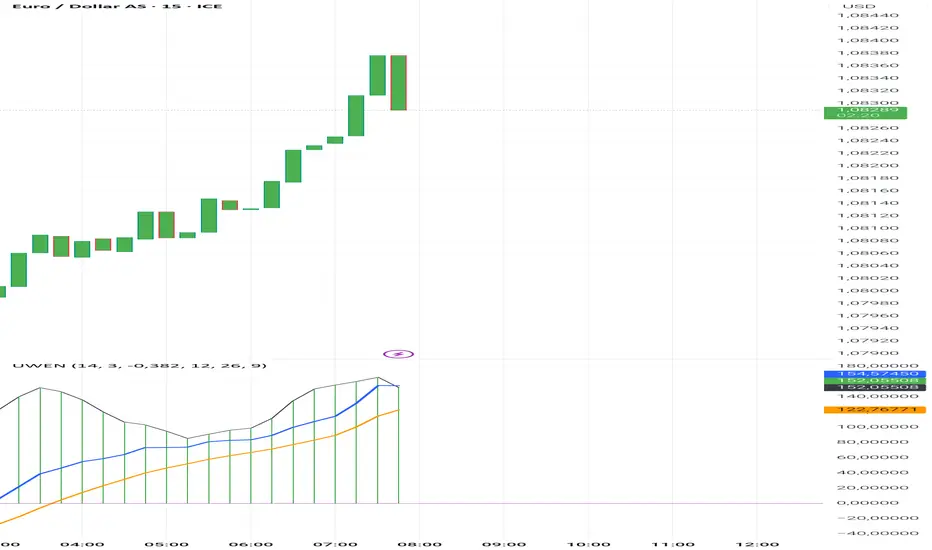
This Pine Script defines a trading indicator called "Uwen FX: UWEN Strategy" Where ideas coming from Arab Syaukani and modified by Fiki Hafana. It combines a CCI-based T3 Smoothed Indicator with a MACD overlay. Here's a breakdown of what it does:
Key Components of the Script:
1. CCI (Commodity Channel Index) with T3 Smoothing
Uses a T3 smoothing algorithm on the CCI to generate a smoother momentum signal. The smoothing formula is applied iteratively using weighted averages. The final result (xccir) is plotted as a histogram, colored green for bullish signals and red for bearish signals.
2. MACD (Moving Average Convergence Divergence)
The MACD is scaled to match the range of the smoothed CCI for better visualization. Signal Line and MACD Line are plotted if showMACD is enabled. The normalization ensures that MACD values align with the CCI-based indicator.
3. Bar Coloring for Trend Indication
Green bars indicate a positive trend (pos = 1).
Red bars indicate a negative trend (pos = -1).
Blue bars appear when the trend is neutral.
How It Can Be Used:
Buy Signal: When the xccir (smoothed CCI) turns green, indicating bullish momentum.
Sell Signal: When xccir turns red, indicating bearish momentum.
MACD Confirmation: Helps confirm the trend direction by aligning with xccir.
I will add more interesting features if this indicator seems profitable
오픈 소스 스크립트
트레이딩뷰의 진정한 정신에 따라, 이 스크립트의 작성자는 이를 오픈소스로 공개하여 트레이더들이 기능을 검토하고 검증할 수 있도록 했습니다. 작성자에게 찬사를 보냅니다! 이 코드는 무료로 사용할 수 있지만, 코드를 재게시하는 경우 하우스 룰이 적용된다는 점을 기억하세요.
면책사항
해당 정보와 게시물은 금융, 투자, 트레이딩 또는 기타 유형의 조언이나 권장 사항으로 간주되지 않으며, 트레이딩뷰에서 제공하거나 보증하는 것이 아닙니다. 자세한 내용은 이용 약관을 참조하세요.
오픈 소스 스크립트
트레이딩뷰의 진정한 정신에 따라, 이 스크립트의 작성자는 이를 오픈소스로 공개하여 트레이더들이 기능을 검토하고 검증할 수 있도록 했습니다. 작성자에게 찬사를 보냅니다! 이 코드는 무료로 사용할 수 있지만, 코드를 재게시하는 경우 하우스 룰이 적용된다는 점을 기억하세요.
면책사항
해당 정보와 게시물은 금융, 투자, 트레이딩 또는 기타 유형의 조언이나 권장 사항으로 간주되지 않으며, 트레이딩뷰에서 제공하거나 보증하는 것이 아닙니다. 자세한 내용은 이용 약관을 참조하세요.