OPEN-SOURCE SCRIPT
업데이트됨 Multi timeframe Stochastic RSI Screener by noop42

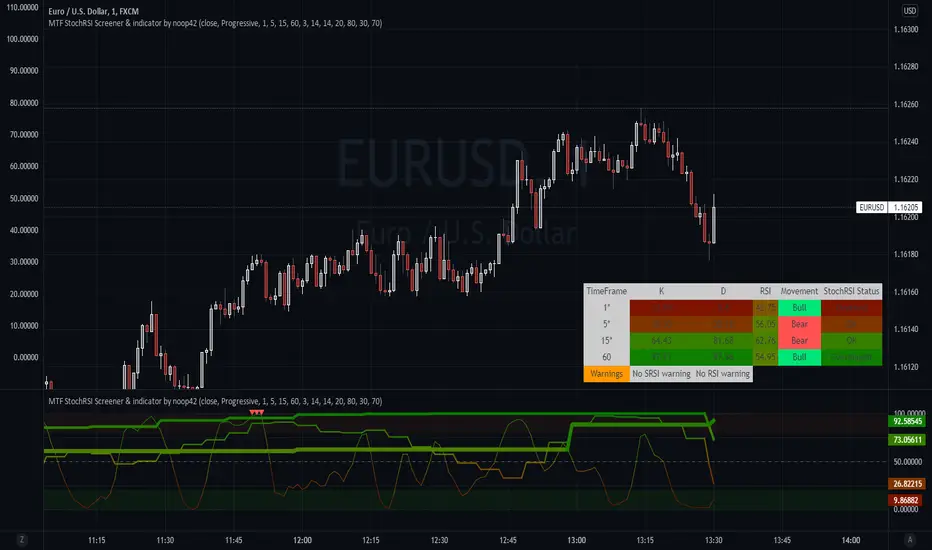
Here is a custom x4 timeframes Stochastic RSI screener to add on your charts.
Options
Default parameters
Notes
Use the lowest timeframe configured on the screener to get real values
A classic x3 multi-timeframe Stochastic RSI indicator is also available https://fr.tradingview.com/script/OwRzXzIb/
Options
- Repaint mode : if enabled: values are updated in live, if disabled: values are updated once the concerned candle is closed
Default parameters
- Timeframes: 1, 5, 15, 60
- Repaint mode: enabled
Notes
Use the lowest timeframe configured on the screener to get real values
A classic x3 multi-timeframe Stochastic RSI indicator is also available https://fr.tradingview.com/script/OwRzXzIb/
릴리즈 노트
This update includes the indicator and the screener I previously developed.Updates:
- The oscillator prints the fourth timeframe which have already been included in the screener
- The screener is now including a warning field to show overbought/oversold signals convergence, which could indicate an incoming movement reversal (Warnings are calculated on the three lowest timeframes (the highest is ignored))
- Warnings are calculated on the three lowest timeframes (the highest is ignored)
- The screener can be disabled
- Overbought and Oversold signals are now based on the average value between K and D lines
- Up and Down triangles have been added to the oscillator to show OB/OS convergences
- Visual improvements
Note: This is an indicator, not a complete and trustable strategy
Hope you'll enjoy it :)
릴리즈 노트
Updates- A column showing each timeframe's RSI value has been added to the screener
- Floating values have been limited to only 2 digits after the comma
- A second warning field concerning the three lowest timeframes' RSI have been added to show OB/OS convergences
릴리즈 노트
Update- New option to select which timeframe(s) must be taken into consideration for convergence signals (Selected timeframes can be distinguished in the screener, followed by a * char in the timeframes column).
- If you plan to use the screener only and to move it on your main chart, you can now disable displays of stochastic rsi lines and zones. (thx to EtCrt for the idea)
릴리즈 노트
Updates- A new color mode has been added. When enabled, it automatically apply the appropriate color from green to red (on the screener, and also on lines when the average mode is enabled). This is the new default color mode.
- Converted to Pinescript v5
오픈 소스 스크립트
트레이딩뷰의 진정한 정신에 따라, 이 스크립트의 작성자는 이를 오픈소스로 공개하여 트레이더들이 기능을 검토하고 검증할 수 있도록 했습니다. 작성자에게 찬사를 보냅니다! 이 코드는 무료로 사용할 수 있지만, 코드를 재게시하는 경우 하우스 룰이 적용된다는 점을 기억하세요.
면책사항
해당 정보와 게시물은 금융, 투자, 트레이딩 또는 기타 유형의 조언이나 권장 사항으로 간주되지 않으며, 트레이딩뷰에서 제공하거나 보증하는 것이 아닙니다. 자세한 내용은 이용 약관을 참조하세요.
오픈 소스 스크립트
트레이딩뷰의 진정한 정신에 따라, 이 스크립트의 작성자는 이를 오픈소스로 공개하여 트레이더들이 기능을 검토하고 검증할 수 있도록 했습니다. 작성자에게 찬사를 보냅니다! 이 코드는 무료로 사용할 수 있지만, 코드를 재게시하는 경우 하우스 룰이 적용된다는 점을 기억하세요.
면책사항
해당 정보와 게시물은 금융, 투자, 트레이딩 또는 기타 유형의 조언이나 권장 사항으로 간주되지 않으며, 트레이딩뷰에서 제공하거나 보증하는 것이 아닙니다. 자세한 내용은 이용 약관을 참조하세요.