OPEN-SOURCE SCRIPT
Webby % Off 52 Week
업데이트됨
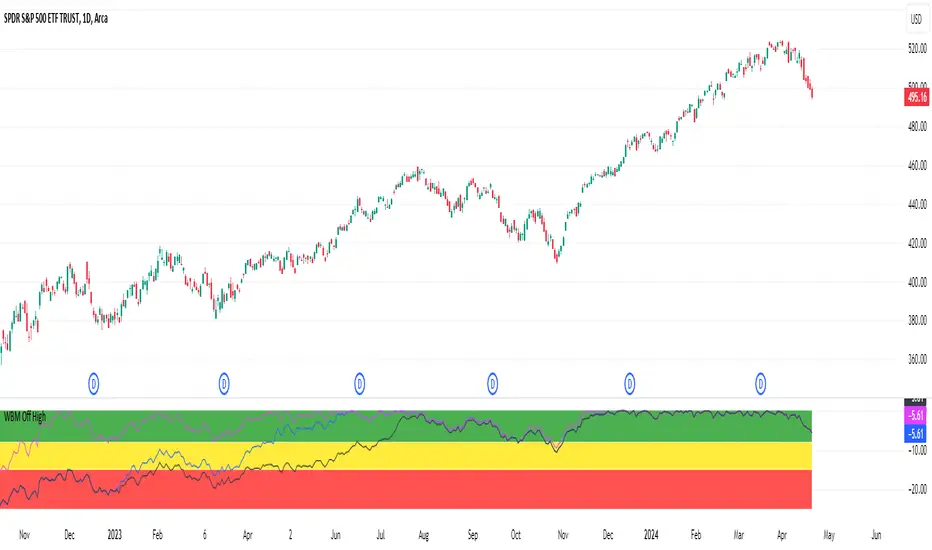
This indicator measures a stocks distance from its 52 week high. The concept is based on what Mike Webster shared on his appearance on IBD Live, allowing users to see if a current pullback from the highs is normal compared to historical pullbacks or if more attention is warranted.
It is also important to pay attention to a stocks 52 week high in relation to it's current price to confirm trend, spot potential breakout levels or see if the high acts as an area of resistance.
The indicator has 3 different zones with shaded backgrounds to easily spot the distance off of the high.
Zones
Similar Healthy Pullbacks

Possible concern as pullback undercuts previous pullback level

It is also important to pay attention to a stocks 52 week high in relation to it's current price to confirm trend, spot potential breakout levels or see if the high acts as an area of resistance.
The indicator has 3 different zones with shaded backgrounds to easily spot the distance off of the high.
Zones
- Green Zone - 0 to 8% off highs
- Yellow Zone - 8 to 15% off highs
- Red Zone - 15 to 25% off highs
Similar Healthy Pullbacks
Possible concern as pullback undercuts previous pullback level
릴리즈 노트
Update now includes option to see ATRs off the high. 릴리즈 노트
Update includes the % or ATR off of two additional highs. - 50 day high
- 18 month high
릴리즈 노트
Option to change the ATR length릴리즈 노트
The user can select the source for the measurement. For example, if "low" is selected, the measurement will show the distance from the bar's low to the highs. If "close" is selected, it will measure the distance from the bar's close to the highs.Trusted Pine programmer. Send me a message for script development.
오픈 소스 스크립트
진정한 TradingView 정신에 따라, 이 스크립트의 저자는 트레이더들이 이해하고 검증할 수 있도록 오픈 소스로 공개했습니다. 저자에게 박수를 보냅니다! 이 코드는 무료로 사용할 수 있지만, 출판물에서 이 코드를 재사용하는 것은 하우스 룰에 의해 관리됩니다. 님은 즐겨찾기로 이 스크립트를 차트에서 쓸 수 있습니다.
면책사항
이 정보와 게시물은 TradingView에서 제공하거나 보증하는 금융, 투자, 거래 또는 기타 유형의 조언이나 권고 사항을 의미하거나 구성하지 않습니다. 자세한 내용은 이용 약관을 참고하세요.