Description of this indicator from its author:
Average Sentiment Oscillator
Momentum oscillator of averaged bull/bear percentages.
We suggest using it as a relatively accurate way to gauge the sentiment of a given period of candles, as a trend filter or for entry/exit signals.
It’s a combination of two algorithms, both essentially the same but applied in a different way. The first one analyzes the bullish/bearishness of each bar using OHLC prices then averages all percentages in the period group of bars (eg. 10) to give the final % value. The second one treats the period group of bars as one bar and then determines the sentiment percentage with the OHLC points of the group. The first one is noisy but more accurate in respect to intra-bar sentiment, whereas the second gives a smoother result and adds more weight to the range of price movement. They can be used separately as Mode 1 and Mode 2 in the indicator settings, or combined as Mode 0.
Original indicator idea from Benjamin Joshua Nash, converted from MT4 version
Usage:
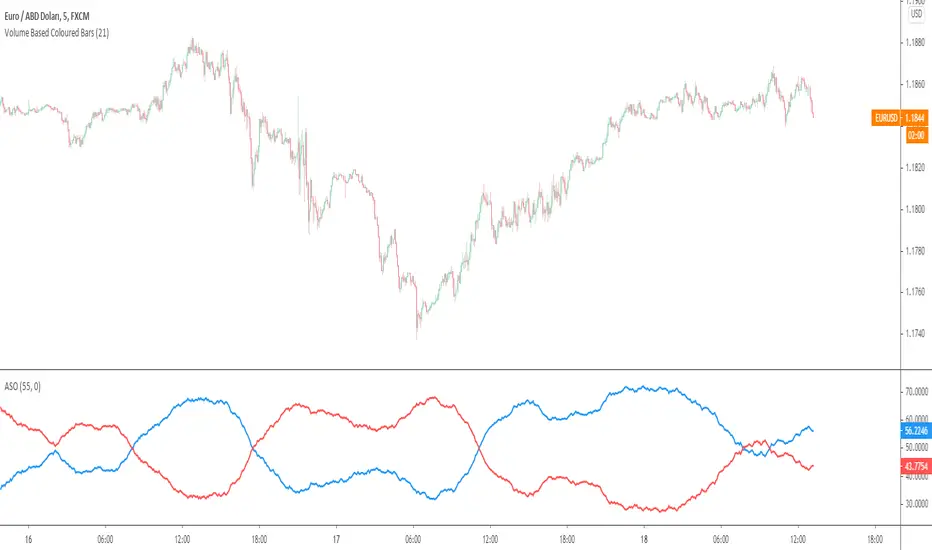
The blue line is Bulls %, red line is Bears %. As they are both percentages of 100, they mirror each other. The higher line is the dominating sentiment. The lines crossing the 50% centreline mark the shift of power between bulls and bears, and this often provides a good entry or exit signal, i.e. if the blue line closes above 50% on the last bar, Buy or exit Sell, if the red line closes above 50% on the last bar, Sell or exit Buy. These entries are better when average volume is high.
It's also possible to see the relative strength of the swings/trend, i.e. a blue peak is higher than the preceding red one. A clear divergence can be seen in the picture as the second bullish peak registers as a lower strength on the oscillator but moved higher on the price chart. By setting up levels at the 70% and 30% mark the oscillator can also be used for trading overbought/oversold levels similar to a Stochastic or RSI. As is the rule with most indicators, a smaller period gives more leading signals and a larger period gives less false signals.
Average Sentiment Oscillator
Momentum oscillator of averaged bull/bear percentages.
We suggest using it as a relatively accurate way to gauge the sentiment of a given period of candles, as a trend filter or for entry/exit signals.
It’s a combination of two algorithms, both essentially the same but applied in a different way. The first one analyzes the bullish/bearishness of each bar using OHLC prices then averages all percentages in the period group of bars (eg. 10) to give the final % value. The second one treats the period group of bars as one bar and then determines the sentiment percentage with the OHLC points of the group. The first one is noisy but more accurate in respect to intra-bar sentiment, whereas the second gives a smoother result and adds more weight to the range of price movement. They can be used separately as Mode 1 and Mode 2 in the indicator settings, or combined as Mode 0.
Original indicator idea from Benjamin Joshua Nash, converted from MT4 version
Usage:
The blue line is Bulls %, red line is Bears %. As they are both percentages of 100, they mirror each other. The higher line is the dominating sentiment. The lines crossing the 50% centreline mark the shift of power between bulls and bears, and this often provides a good entry or exit signal, i.e. if the blue line closes above 50% on the last bar, Buy or exit Sell, if the red line closes above 50% on the last bar, Sell or exit Buy. These entries are better when average volume is high.
It's also possible to see the relative strength of the swings/trend, i.e. a blue peak is higher than the preceding red one. A clear divergence can be seen in the picture as the second bullish peak registers as a lower strength on the oscillator but moved higher on the price chart. By setting up levels at the 70% and 30% mark the oscillator can also be used for trading overbought/oversold levels similar to a Stochastic or RSI. As is the rule with most indicators, a smaller period gives more leading signals and a larger period gives less false signals.
릴리즈 노트
fixed an error in code오픈 소스 스크립트
트레이딩뷰의 진정한 정신에 따라, 이 스크립트의 작성자는 이를 오픈소스로 공개하여 트레이더들이 기능을 검토하고 검증할 수 있도록 했습니다. 작성자에게 찬사를 보냅니다! 이 코드는 무료로 사용할 수 있지만, 코드를 재게시하는 경우 하우스 룰이 적용된다는 점을 기억하세요.
Telegram t.me/AlgoRhytm
YouTube (Turkish): youtube.com/c/kivancozbilgic
YouTube (English): youtube.com/c/AlgoWorld
YouTube (Turkish): youtube.com/c/kivancozbilgic
YouTube (English): youtube.com/c/AlgoWorld
면책사항
해당 정보와 게시물은 금융, 투자, 트레이딩 또는 기타 유형의 조언이나 권장 사항으로 간주되지 않으며, 트레이딩뷰에서 제공하거나 보증하는 것이 아닙니다. 자세한 내용은 이용 약관을 참조하세요.
오픈 소스 스크립트
트레이딩뷰의 진정한 정신에 따라, 이 스크립트의 작성자는 이를 오픈소스로 공개하여 트레이더들이 기능을 검토하고 검증할 수 있도록 했습니다. 작성자에게 찬사를 보냅니다! 이 코드는 무료로 사용할 수 있지만, 코드를 재게시하는 경우 하우스 룰이 적용된다는 점을 기억하세요.
Telegram t.me/AlgoRhytm
YouTube (Turkish): youtube.com/c/kivancozbilgic
YouTube (English): youtube.com/c/AlgoWorld
YouTube (Turkish): youtube.com/c/kivancozbilgic
YouTube (English): youtube.com/c/AlgoWorld
면책사항
해당 정보와 게시물은 금융, 투자, 트레이딩 또는 기타 유형의 조언이나 권장 사항으로 간주되지 않으며, 트레이딩뷰에서 제공하거나 보증하는 것이 아닙니다. 자세한 내용은 이용 약관을 참조하세요.