PROTECTED SOURCE SCRIPT
업데이트됨 MC RSI + Stoch (multi-level bands)
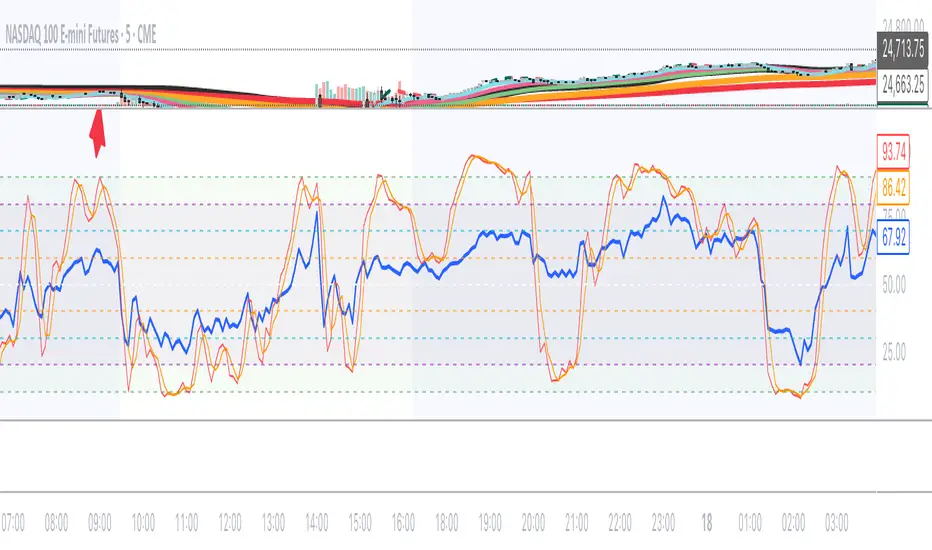
This indicator combines RSI and Stochastic Oscillator into a single panel for easier market analysis. It is designed for traders who want both momentum context and precise timing, with multiple reference levels for better decision-making.
🔧 Features
RSI (Relative Strength Index) with adjustable length (default 14).
Stochastic Oscillator (default 18, 9, 5) with smoothing applied to %K.
Both oscillators plotted in the same scale (0–100) for clear comparison.
Custom horizontal levels:
10 & 90 (purple)
20 & 80 (teal)
30 & 70 (blue)
40 & 60 (gray)
50 midline (red) for balance point reference.
Optional shaded band between 20–80 for quick visualization of momentum extremes.
Toggle switches to show/hide RSI or Stochastic independently.
🎯 How to Use
RSI gives the overall momentum strength.
Stochastic provides faster entry/exit signals by showing short-term momentum shifts.
Use the multi-level bands to identify different market conditions:
10/90 = Extreme exhaustion zones.
20/80 = Overbought/oversold boundaries.
30/70 = Secondary confirmation levels.
40/60 = Neutral momentum bands.
50 = Midline equilibrium.
릴리즈 노트
This indicator combines RSI and Stochastic Oscillator into a single panel for easier market analysis. It is designed for traders who want both momentum context and precise timing, with multiple reference levels for better decision-making.🔧 Features
RSI (Relative Strength Index) with adjustable length (default 14).
Stochastic Oscillator (default 18, 9, 5) with smoothing applied to %K.
Both oscillators plotted in the same scale (0–100) for clear comparison.
Custom horizontal levels:
10 & 90 (purple)
20 & 80 (teal)
30 & 70 (blue)
40 & 60 (gray)
50 midline (red) for balance point reference.
Optional shaded band between 20–80 for quick visualization of momentum extremes.
Toggle switches to show/hide RSI or Stochastic independently.
보호된 스크립트입니다
이 스크립트는 비공개 소스로 게시됩니다. 하지만 이를 자유롭게 제한 없이 사용할 수 있습니다 – 자세한 내용은 여기에서 확인하세요.
면책사항
해당 정보와 게시물은 금융, 투자, 트레이딩 또는 기타 유형의 조언이나 권장 사항으로 간주되지 않으며, 트레이딩뷰에서 제공하거나 보증하는 것이 아닙니다. 자세한 내용은 이용 약관을 참조하세요.
보호된 스크립트입니다
이 스크립트는 비공개 소스로 게시됩니다. 하지만 이를 자유롭게 제한 없이 사용할 수 있습니다 – 자세한 내용은 여기에서 확인하세요.
면책사항
해당 정보와 게시물은 금융, 투자, 트레이딩 또는 기타 유형의 조언이나 권장 사항으로 간주되지 않으며, 트레이딩뷰에서 제공하거나 보증하는 것이 아닙니다. 자세한 내용은 이용 약관을 참조하세요.