PROTECTED SOURCE SCRIPT
Valuation Bands (Dynamic + Table)
Valuation Bands (Dynamic + Table)
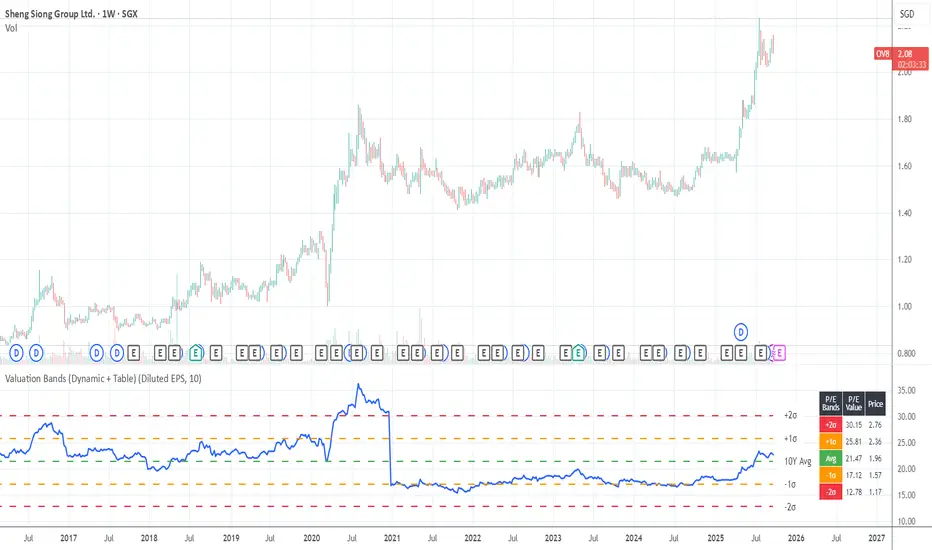
This indicator helps investors assess whether a stock is trading at cheap, fair, or expensive levels relative to its historical valuation multiples. It dynamically calculates valuation ratios such as P/E, P/B, P/S, P/Operating Income, P/Cash Flow, or Dividend Yield over a customizable lookback period (e.g., 10 years).
Using these ratios, the script plots the long-term average alongside ±1σ and ±2σ standard deviation bands, highlighting valuation zones. The included data table displays both the multiple values and their corresponding price levels, making it easy to interpret fair value ranges.
Alerts are built in to notify when the current ratio crosses into undervalued (–2σ) or overvalued (+2σ) zones, helping investors spot potential opportunities or risks.
In short, this tool bridges fundamentals with technical visualization, giving a quick snapshot of how today’s valuation compares to historical norms.
보호된 스크립트입니다
이 스크립트는 비공개 소스로 게시됩니다. 하지만 이를 자유롭게 제한 없이 사용할 수 있습니다 – 자세한 내용은 여기에서 확인하세요.
면책사항
해당 정보와 게시물은 금융, 투자, 트레이딩 또는 기타 유형의 조언이나 권장 사항으로 간주되지 않으며, 트레이딩뷰에서 제공하거나 보증하는 것이 아닙니다. 자세한 내용은 이용 약관을 참조하세요.
면책사항
해당 정보와 게시물은 금융, 투자, 트레이딩 또는 기타 유형의 조언이나 권장 사항으로 간주되지 않으며, 트레이딩뷰에서 제공하거나 보증하는 것이 아닙니다. 자세한 내용은 이용 약관을 참조하세요.