OPEN-SOURCE SCRIPT
We Are Witnessing A Historical Event With A Clear Outcome!!!
"Full Disclosure: I came across this information from SentimenTrader.com
I have no financial affiliation…They provide incredible statistical facts on
The General Market, Currencies, and Futures. They offer a two week free trial.
I Highly Recommend.
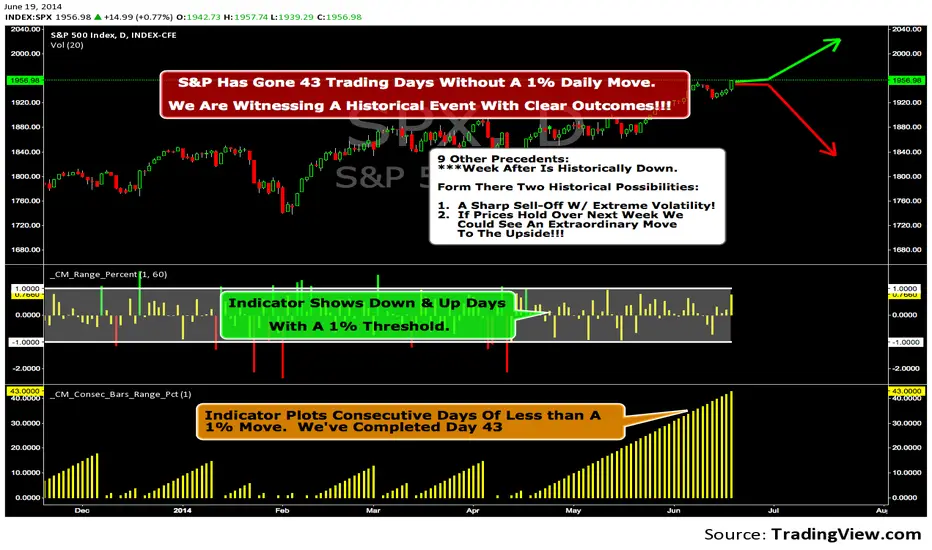
The S&P 500 has gone 43 trading days without a 1% daily move, up or down.
which is the equivalent of two months and one day in trading days.
During this stretch, the S&P has gained more than 4%,
and it has notched a 52-week high recently as well.
Since 1952, there were nine other precedents. All of
these went 42 trading days without a 1% move, all of
them saw the S&P gain at least 4% during their streaks,
and all of them saw the S&P close at a 52-week highs.
***There was consistent weakness a week later, with only three
gainers, and all below +0.5%.
***After that, stocks did better, often continuing an Extraordinary move higher.
Charts can sometimes give us a better nuance than
numbers from a table, and from the charts we can see a
general pattern -
***if stocks held up well in the following
weeks, then they tended to do extremely well in the
months ahead.
***If stocks started to stumble after this two-
month period of calm, however, then the following months
tended to show a lot more volatility.
We already know we're seeing an exceptional market
environment at the moment, going against a large number
of precedents that argued for weakness here, instead of
the rally we've seen. If we continue to head higher in
spite of everything, these precedents would suggest that
we're in the midst of something that could be TRULY EXTRAORDINARY.
I have no financial affiliation…They provide incredible statistical facts on
The General Market, Currencies, and Futures. They offer a two week free trial.
I Highly Recommend.
The S&P 500 has gone 43 trading days without a 1% daily move, up or down.
which is the equivalent of two months and one day in trading days.
During this stretch, the S&P has gained more than 4%,
and it has notched a 52-week high recently as well.
Since 1952, there were nine other precedents. All of
these went 42 trading days without a 1% move, all of
them saw the S&P gain at least 4% during their streaks,
and all of them saw the S&P close at a 52-week highs.
***There was consistent weakness a week later, with only three
gainers, and all below +0.5%.
***After that, stocks did better, often continuing an Extraordinary move higher.
Charts can sometimes give us a better nuance than
numbers from a table, and from the charts we can see a
general pattern -
***if stocks held up well in the following
weeks, then they tended to do extremely well in the
months ahead.
***If stocks started to stumble after this two-
month period of calm, however, then the following months
tended to show a lot more volatility.
We already know we're seeing an exceptional market
environment at the moment, going against a large number
of precedents that argued for weakness here, instead of
the rally we've seen. If we continue to head higher in
spite of everything, these precedents would suggest that
we're in the midst of something that could be TRULY EXTRAORDINARY.
오픈 소스 스크립트
트레이딩뷰의 진정한 정신에 따라, 이 스크립트의 작성자는 이를 오픈소스로 공개하여 트레이더들이 기능을 검토하고 검증할 수 있도록 했습니다. 작성자에게 찬사를 보냅니다! 이 코드는 무료로 사용할 수 있지만, 코드를 재게시하는 경우 하우스 룰이 적용된다는 점을 기억하세요.
Coming Soon: ChrisMoodyTrading.com
면책사항
해당 정보와 게시물은 금융, 투자, 트레이딩 또는 기타 유형의 조언이나 권장 사항으로 간주되지 않으며, 트레이딩뷰에서 제공하거나 보증하는 것이 아닙니다. 자세한 내용은 이용 약관을 참조하세요.