INVITE-ONLY SCRIPT
업데이트됨 MVEX VOLA MODEL
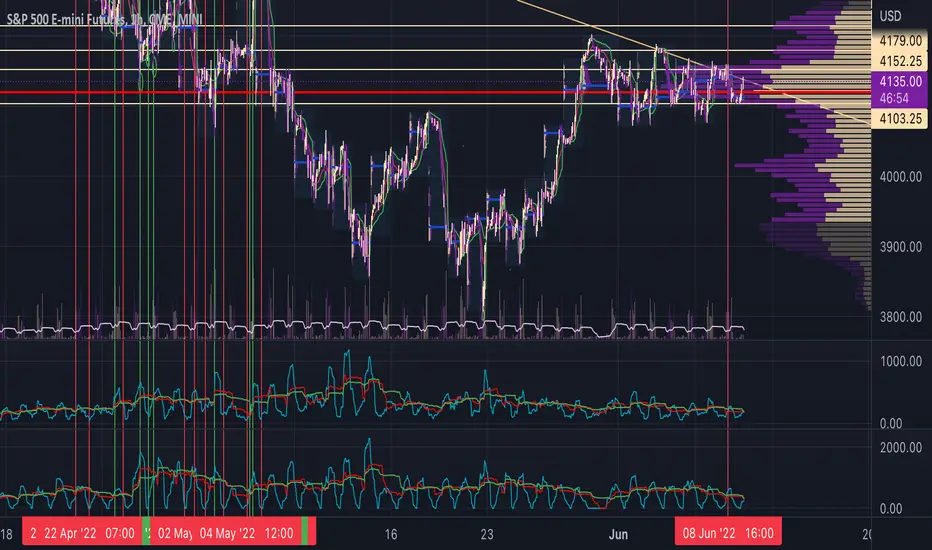
To use this script which focusses on vol on the given equity/commodity/price pair its focussed on at its core methodology. We use ES1 here as an example on how this indicator can be used. This indicator is mainly for ES/NQ and its constituents (except consumer staples, energy etc) which lack the same correlations.
Note the red lines indicate where buy signals occurred an example listed below. Note the best timeframes to use this indicator include (intraday - 1d trades) 30min, 1hr and Daily for multi day trades.
This is distilled into a simple method where you can use this indicator to gauge a potential buy or sell signal. The red shows a sell signal and a green which is a buy i.e. when the blue line short term signal (blue line) has a major divergence vs the mid and long term then this is typically a sell signal. This is shown in the chart above.
The green lines indicate where buy signals occurred with an example listed below.
The same goes for the reverse where the short term signal (blue line) is higher then we have a view of a potential buy signal.
Once again when the VVS (Short term signal) is flattened out then we have a slowing done in the movement of price action and a reversion has the potential to occur.
Once again there are times where the signal will not work, as with every indicator, model etc nothing hits 100% and I doubt there ever will be such an indicator to exist. As with everything please manage your risk.
릴리즈 노트
Minor tweaks초대 전용 스크립트
이 스크립트는 작성자가 승인한 사용자만 접근할 수 있습니다. 사용하려면 요청 후 승인을 받아야 하며, 일반적으로 결제 후에 허가가 부여됩니다. 자세한 내용은 아래 작성자의 안내를 따르거나 vexxly에게 직접 문의하세요.
트레이딩뷰는 스크립트의 작동 방식을 충분히 이해하고 작성자를 완전히 신뢰하지 않는 이상, 해당 스크립트에 비용을 지불하거나 사용하는 것을 권장하지 않습니다. 커뮤니티 스크립트에서 무료 오픈소스 대안을 찾아보실 수도 있습니다.
작성자 지시 사항
Feel free to reach out
면책사항
해당 정보와 게시물은 금융, 투자, 트레이딩 또는 기타 유형의 조언이나 권장 사항으로 간주되지 않으며, 트레이딩뷰에서 제공하거나 보증하는 것이 아닙니다. 자세한 내용은 이용 약관을 참조하세요.
초대 전용 스크립트
이 스크립트는 작성자가 승인한 사용자만 접근할 수 있습니다. 사용하려면 요청 후 승인을 받아야 하며, 일반적으로 결제 후에 허가가 부여됩니다. 자세한 내용은 아래 작성자의 안내를 따르거나 vexxly에게 직접 문의하세요.
트레이딩뷰는 스크립트의 작동 방식을 충분히 이해하고 작성자를 완전히 신뢰하지 않는 이상, 해당 스크립트에 비용을 지불하거나 사용하는 것을 권장하지 않습니다. 커뮤니티 스크립트에서 무료 오픈소스 대안을 찾아보실 수도 있습니다.
작성자 지시 사항
Feel free to reach out
면책사항
해당 정보와 게시물은 금융, 투자, 트레이딩 또는 기타 유형의 조언이나 권장 사항으로 간주되지 않으며, 트레이딩뷰에서 제공하거나 보증하는 것이 아닙니다. 자세한 내용은 이용 약관을 참조하세요.