OPEN-SOURCE SCRIPT
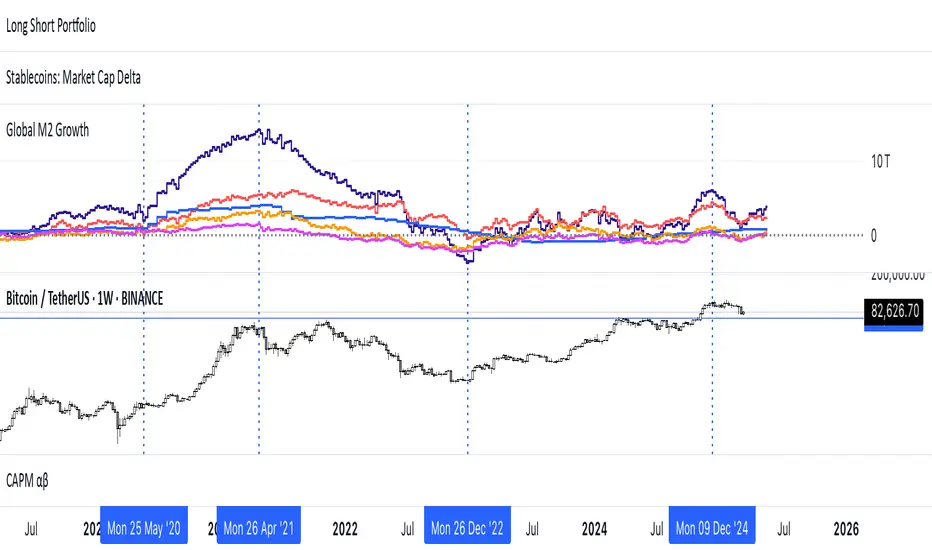
Global M2 Money Supply (USD) Growth

The Global M2 Growth indicator evaluates the total liquid money supply, including cash, checking deposits, and assets that can be easily converted to cash. It reflects changes in global liquidity by tracking year-on-year (YoY) changes in the Global M2 money supply rather than its absolute value. This approach highlights the velocity of liquidity expansion or contraction, offering a clearer understanding of its correlation with asset performance, such as Bitcoin.
How It Works
When the Global M2 money supply expands, it reflects an increase in available liquidity. This often leads to an influx of capital into higher-yielding and riskier assets like Bitcoin, equities, and commodities. Conversely, when M2 contracts, liquidity tightens, leading to declines in the values of these assets.
An essential insight is that Bitcoin's price is not immediately affected by changes in M2. Research shows a lag of approximately 56-60 days (around two months) between liquidity changes and Bitcoin's price movements. Shifting the liquidity data forward by this period improves the correlation between Global M2 and Bitcoin performance.
How to Use
Track Global M2 YoY Change: Focus on liquidity's yearly change to identify trends. Rapid increases in liquidity often signify favorable conditions for Bitcoin and other risk assets to rise, while contractions often predict price declines or consolidation phases.
Account for the Lag Effect: Incorporate the two-month lag into your analysis to predict Bitcoin's potential moves more accurately. For instance, a recent resurgence in liquidity growth could signal a Bitcoin rally within the next two months.
Use as a Macro Indicator: Monitor liquidity trends alongside other economic indicators and asset performance metrics to build a more comprehensive investment framework.
By tracking these dynamics, traders and investors can better anticipate Bitcoin's trajectory and make informed decisions.
오픈 소스 스크립트
트레이딩뷰의 진정한 정신에 따라, 이 스크립트의 작성자는 이를 오픈소스로 공개하여 트레이더들이 기능을 검토하고 검증할 수 있도록 했습니다. 작성자에게 찬사를 보냅니다! 이 코드는 무료로 사용할 수 있지만, 코드를 재게시하는 경우 하우스 룰이 적용된다는 점을 기억하세요.
면책사항
해당 정보와 게시물은 금융, 투자, 트레이딩 또는 기타 유형의 조언이나 권장 사항으로 간주되지 않으며, 트레이딩뷰에서 제공하거나 보증하는 것이 아닙니다. 자세한 내용은 이용 약관을 참조하세요.
오픈 소스 스크립트
트레이딩뷰의 진정한 정신에 따라, 이 스크립트의 작성자는 이를 오픈소스로 공개하여 트레이더들이 기능을 검토하고 검증할 수 있도록 했습니다. 작성자에게 찬사를 보냅니다! 이 코드는 무료로 사용할 수 있지만, 코드를 재게시하는 경우 하우스 룰이 적용된다는 점을 기억하세요.
면책사항
해당 정보와 게시물은 금융, 투자, 트레이딩 또는 기타 유형의 조언이나 권장 사항으로 간주되지 않으며, 트레이딩뷰에서 제공하거나 보증하는 것이 아닙니다. 자세한 내용은 이용 약관을 참조하세요.