OPEN-SOURCE SCRIPT
업데이트됨 RSI For Loop
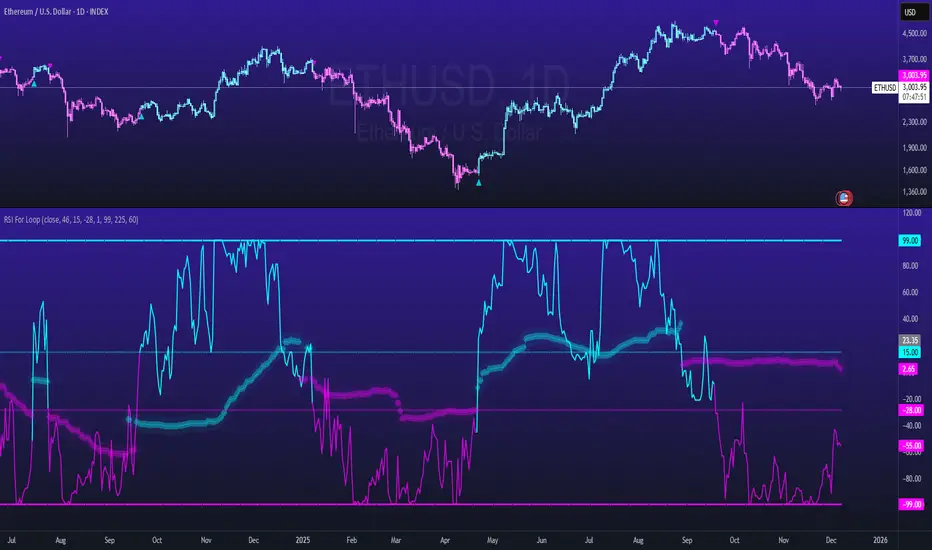
RSI For Loop – Enhanced RSI Dominance Oscillator
Original concept & innovation ©viResearch
Enhanced version with historical-comparison loop, median-based statistical strength bands, asymmetric thresholds, and visual upgrades
Core Concept (viResearch)
viResearch was the first to introduce the groundbreaking idea of replacing traditional fixed RSI levels with a loop-based scoring system that evaluates RSI behavior across a defined range, creating a dynamic, self-normalizing momentum score that dramatically reduces false signals in trending markets.
Key Enhancements in This Version
I kept the core brilliance of viResearch's loop concept but completely rewrote the scoring mechanism to make it even more powerful and adaptive:
1. Historical Dominance Comparison
The loop directly compares the current RSI value to the actual RSI values of the previous 1–99 bars (user-adjustable).
→ +1 for every past bar the current RSI beats
→ –1 for every past bar it loses to
This transforms the indicator into a true RSI Dominance / Percentile-Rank oscillator that instantly shows whether current momentum is stronger or weaker than nearly all recent history – perfectly adaptive to any market regime, volatility level, or asset.
2. Median + 3σ Statistical Strength Bands
Added a rolling median of the dominance score plus dynamic ±3σ bands calculated from the RSI score median standard deviation.
These bands identify genuinely extreme momentum phases (statistically rare events) that only occur during the strongest momentum or capitulation moves – giving high-conviction confirmation.
3. Visual & Practical Upgrades
- Clean bar/candle coloring
- On-chart triangle signals at trend changes
- Diamond stepline ±3σ bands
- Built-in alerts for both trend changes and extreme strength phases
- 9 professional color themes
How to Use It
Primary Trend Signals
- Green triangle + bullish bar color → New bullish momentum regime (score crosses above +15)
- Magenta triangle + bearish bar color → New bearish momentum regime (score crosses below –28)
These are some of the cleanest trend-change signals you will ever see – especially powerful on daily/weekly charts.
Extreme Strength Confirmation
Score breaks above the upper 3σ diamond line → Exceptional bullish strength/dominance (add to longs, strength behind the asset)
Score breaks below the lower 3σ diamond line → Exceptional bearish strength/dominance (capitulation or weakness)
These are rarer, very high-probability zones.
Zero-Line Context
Above zero = current RSI stronger than average recent history
Below zero = weaker than average recent history
Near zero = choppy/range-bound (stay out or mean-reversion trade)
Recommended Settings
RSI Length: 46
Loop range: 1 to 99 (~3–6 months on daily)
Long Threshold: +15
Short Threshold: –28
Median Length: 225
SD Length: 60
Works on all assets and timeframes. Absolutely deadly on daily/weekly for swing and position trading, and still excellent on 4H/30min for crypto/stocks.
This enhanced version honors viResearch's original genius while improving on it with true historical comparison and statistical extreme detection – delivering what is, in my opinion, one of the cleanest and most powerful momentum/trend indicators available on TradingView.
Backtests are based on past results and are not indicative of future performance.
릴리즈 노트
- name change of signal bool오픈 소스 스크립트
트레이딩뷰의 진정한 정신에 따라, 이 스크립트의 작성자는 이를 오픈소스로 공개하여 트레이더들이 기능을 검토하고 검증할 수 있도록 했습니다. 작성자에게 찬사를 보냅니다! 이 코드는 무료로 사용할 수 있지만, 코드를 재게시하는 경우 하우스 룰이 적용된다는 점을 기억하세요.
면책사항
해당 정보와 게시물은 금융, 투자, 트레이딩 또는 기타 유형의 조언이나 권장 사항으로 간주되지 않으며, 트레이딩뷰에서 제공하거나 보증하는 것이 아닙니다. 자세한 내용은 이용 약관을 참조하세요.
오픈 소스 스크립트
트레이딩뷰의 진정한 정신에 따라, 이 스크립트의 작성자는 이를 오픈소스로 공개하여 트레이더들이 기능을 검토하고 검증할 수 있도록 했습니다. 작성자에게 찬사를 보냅니다! 이 코드는 무료로 사용할 수 있지만, 코드를 재게시하는 경우 하우스 룰이 적용된다는 점을 기억하세요.
면책사항
해당 정보와 게시물은 금융, 투자, 트레이딩 또는 기타 유형의 조언이나 권장 사항으로 간주되지 않으며, 트레이딩뷰에서 제공하거나 보증하는 것이 아닙니다. 자세한 내용은 이용 약관을 참조하세요.