OPEN-SOURCE SCRIPT
ES on MNQ
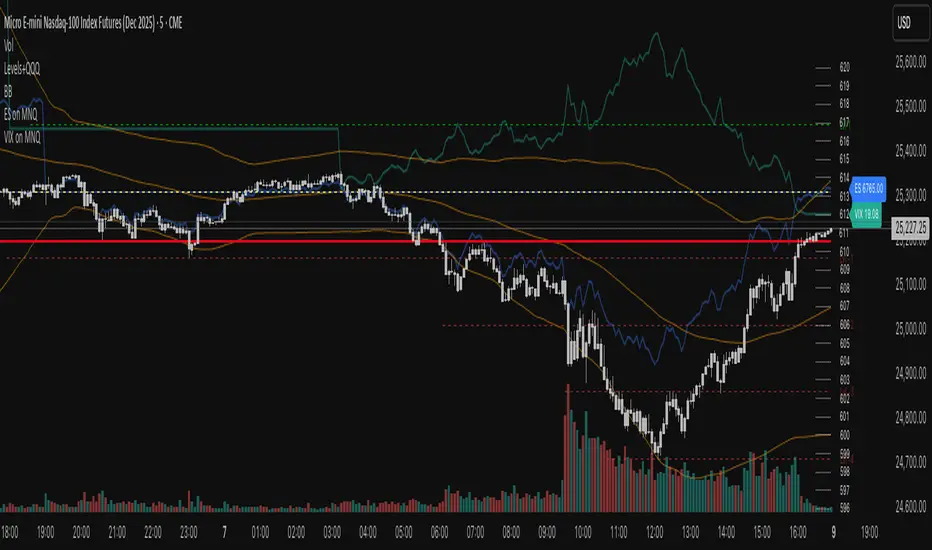
ES on MNQ — ES percent-move overlay on the MNQ price scale.
Overview
This indicator projects the ES’s intraday percent change since session open onto the MNQ price scale. At the session start (18:00 chart time), it stores the ES open and the MNQ open, tracks ES’s percentage move from that anchor, and applies the same percent move to the MNQ open. The result is a single line that behaves like ES but is plotted in MNQ points—useful for spotting convergence/divergence, failed breaks, and mean-reversion setups between ES and MNQ.
How it works
1. Detects session open (18:00 on your chart).
2. Saves ES_open and MNQ_open.
3. Computes pct = (ES_close - ES_open) / ES_open.
4. Plots MNQ_open * (1 + pct) as the ES-on-MNQ line.
A label on the last bar shows the current ES value for quick reference.
Inputs
• ES Symbol: default ES1! (change if you use a different continuous).
• Line Color: color of the overlaid ES-on-MNQ line.
Works best on intraday timeframes and when your chart’s session aligns with ES.
Why it’s useful
• Highlights divergences (MNQ decoupling from ES baseline).
• Aids confirmation on pullbacks/breakouts when MNQ’s move disagrees with the ES-based projection.
• Helps risk control by flagging stretches likely to revert toward the ES-anchored path.
Notes & limitations
• This is a percent-rebasing overlay, not a hedge ratio, fair value, or spread model.
• Session/timezone settings matter; if your feed doesn’t print exactly at 18:00 on a higher timeframe, use a smaller TF or adjust session settings.
• Minor differences between ES (full) and MNQ (micro) and data latency can create small offsets.
Disclaimer
For educational use only. Not financial advice. Use proper risk management.
오픈 소스 스크립트
트레이딩뷰의 진정한 정신에 따라, 이 스크립트의 작성자는 이를 오픈소스로 공개하여 트레이더들이 기능을 검토하고 검증할 수 있도록 했습니다. 작성자에게 찬사를 보냅니다! 이 코드는 무료로 사용할 수 있지만, 코드를 재게시하는 경우 하우스 룰이 적용된다는 점을 기억하세요.
면책사항
해당 정보와 게시물은 금융, 투자, 트레이딩 또는 기타 유형의 조언이나 권장 사항으로 간주되지 않으며, 트레이딩뷰에서 제공하거나 보증하는 것이 아닙니다. 자세한 내용은 이용 약관을 참조하세요.
오픈 소스 스크립트
트레이딩뷰의 진정한 정신에 따라, 이 스크립트의 작성자는 이를 오픈소스로 공개하여 트레이더들이 기능을 검토하고 검증할 수 있도록 했습니다. 작성자에게 찬사를 보냅니다! 이 코드는 무료로 사용할 수 있지만, 코드를 재게시하는 경우 하우스 룰이 적용된다는 점을 기억하세요.
면책사항
해당 정보와 게시물은 금융, 투자, 트레이딩 또는 기타 유형의 조언이나 권장 사항으로 간주되지 않으며, 트레이딩뷰에서 제공하거나 보증하는 것이 아닙니다. 자세한 내용은 이용 약관을 참조하세요.