OPEN-SOURCE SCRIPT
업데이트됨 Fibonacci Bollinger Volume Weighted Deviation
Discover market dynamics with the 'Fibonacci Bollinger Volume Weighted Deviation' indicator – a unique tool blending Fibonacci ratios, Bollinger Bands, and volume-weighted analysis. Ideal for spotting overbought/oversold conditions and potential market turnarounds, this indicator is a must-have for traders seeking nuanced insights into price behavior and volatility.
Description:
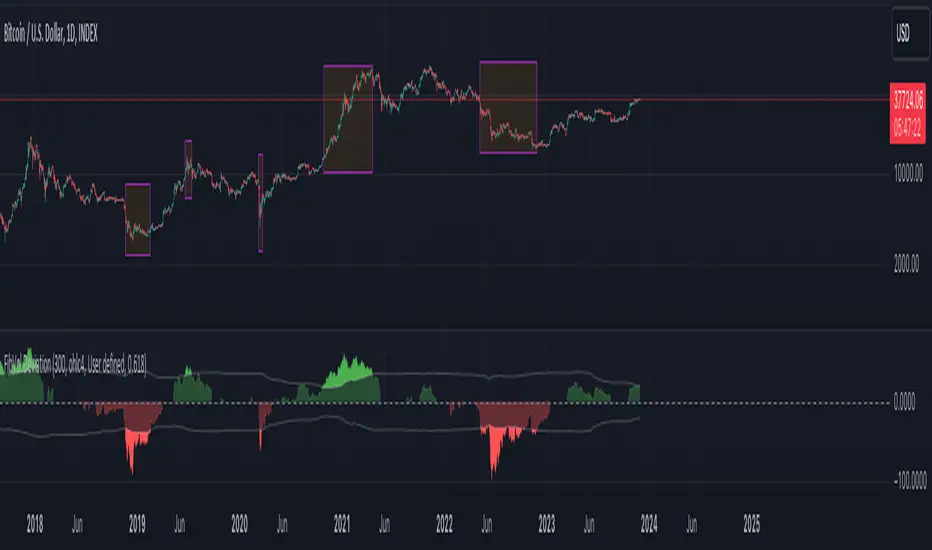
"The 'Fibonacci Bollinger Volume Weighted Deviation' indicator presents a novel approach to market trend analysis by integrating Fibonacci ratios with the classic concept of Bollinger Bands. Designed for traders who incorporate Fibonacci levels in their market analysis, this indicator adapts Bollinger Bands to a user-defined Fibonacci ratio. It creates dynamic upper and lower bands around a Simple Moving Average (SMA), offering insights into price deviations and potential overbought or oversold market states.
Incorporating volume data, this indicator provides a volume-weighted perspective of price deviations. This feature is crucial in gauging the market sentiment, as significant volumes linked with price deviations can signal strong market moves. By plotting these deviations and emphasizing those that significantly diverge from the volume-weighted average, it aids in pinpointing potential turning points or key support and resistance zones.
Versatile in nature, the 'Fibonacci Bollinger Volume Weighted Deviation' indicator is adaptable to various trading styles and market conditions. It proves especially valuable in markets where Fibonacci levels are a key factor. Traders can explore long positions when prices fall below the lower band and consider short positions when prices breach the upper band. The addition of volume-weighted deviation analysis refines these trading signals, offering a more sophisticated and nuanced decision-making process for entries and exits.
As a standalone tool or in conjunction with other technical instruments, this indicator is an invaluable addition to any technical analyst's toolkit. It not only enhances traditional Fibonacci and Bollinger Band methodologies but also integrates volume analysis to provide a comprehensive view of market trends and movements."
Description:
"The 'Fibonacci Bollinger Volume Weighted Deviation' indicator presents a novel approach to market trend analysis by integrating Fibonacci ratios with the classic concept of Bollinger Bands. Designed for traders who incorporate Fibonacci levels in their market analysis, this indicator adapts Bollinger Bands to a user-defined Fibonacci ratio. It creates dynamic upper and lower bands around a Simple Moving Average (SMA), offering insights into price deviations and potential overbought or oversold market states.
Incorporating volume data, this indicator provides a volume-weighted perspective of price deviations. This feature is crucial in gauging the market sentiment, as significant volumes linked with price deviations can signal strong market moves. By plotting these deviations and emphasizing those that significantly diverge from the volume-weighted average, it aids in pinpointing potential turning points or key support and resistance zones.
Versatile in nature, the 'Fibonacci Bollinger Volume Weighted Deviation' indicator is adaptable to various trading styles and market conditions. It proves especially valuable in markets where Fibonacci levels are a key factor. Traders can explore long positions when prices fall below the lower band and consider short positions when prices breach the upper band. The addition of volume-weighted deviation analysis refines these trading signals, offering a more sophisticated and nuanced decision-making process for entries and exits.
As a standalone tool or in conjunction with other technical instruments, this indicator is an invaluable addition to any technical analyst's toolkit. It not only enhances traditional Fibonacci and Bollinger Band methodologies but also integrates volume analysis to provide a comprehensive view of market trends and movements."
릴리즈 노트
Array Size changed / fixed릴리즈 노트
Code refactor오픈 소스 스크립트
트레이딩뷰의 진정한 정신에 따라, 이 스크립트의 작성자는 이를 오픈소스로 공개하여 트레이더들이 기능을 검토하고 검증할 수 있도록 했습니다. 작성자에게 찬사를 보냅니다! 이 코드는 무료로 사용할 수 있지만, 코드를 재게시하는 경우 하우스 룰이 적용된다는 점을 기억하세요.
면책사항
해당 정보와 게시물은 금융, 투자, 트레이딩 또는 기타 유형의 조언이나 권장 사항으로 간주되지 않으며, 트레이딩뷰에서 제공하거나 보증하는 것이 아닙니다. 자세한 내용은 이용 약관을 참조하세요.
오픈 소스 스크립트
트레이딩뷰의 진정한 정신에 따라, 이 스크립트의 작성자는 이를 오픈소스로 공개하여 트레이더들이 기능을 검토하고 검증할 수 있도록 했습니다. 작성자에게 찬사를 보냅니다! 이 코드는 무료로 사용할 수 있지만, 코드를 재게시하는 경우 하우스 룰이 적용된다는 점을 기억하세요.
면책사항
해당 정보와 게시물은 금융, 투자, 트레이딩 또는 기타 유형의 조언이나 권장 사항으로 간주되지 않으며, 트레이딩뷰에서 제공하거나 보증하는 것이 아닙니다. 자세한 내용은 이용 약관을 참조하세요.