PROTECTED SOURCE SCRIPT
MTF Trend Dashboard LITE (Daily & 4H)
Overview
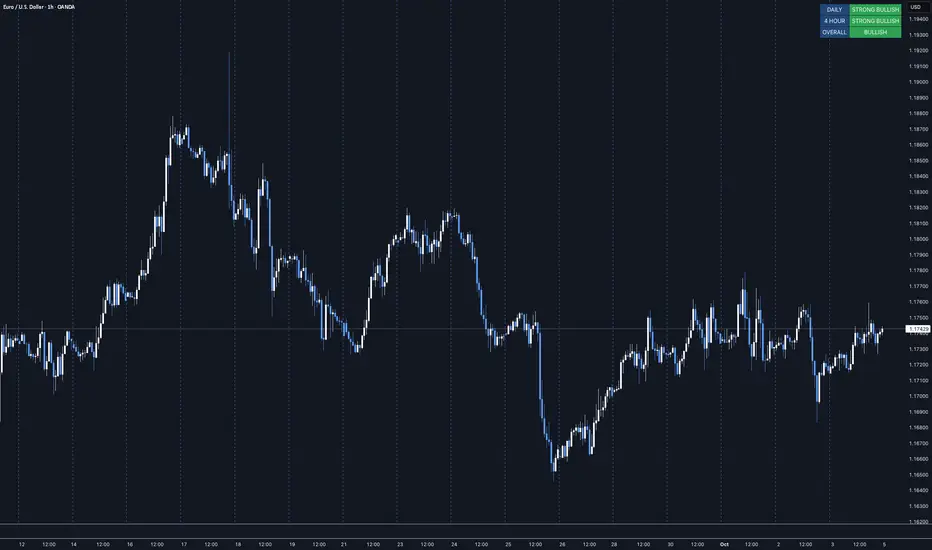
The MTF Trend Dashboard LITE by G.C provides instant directional clarity between the Daily and 4-Hour timeframes using refined EMA (9 / 21) logic.
It’s built for traders who want simple, accurate trend confirmation without switching between multiple charts.
Why It Matters
One of the biggest causes of trading errors is timeframe conflict — seeing a bullish setup on one chart and a bearish signal on another.
This tool solves that problem by showing both the Daily and 4H structure side-by-side, using objective EMA-based logic.
When both agree, bias is strong. When they conflict, it’s a signal to wait.
Core Features
• Two-timeframe dashboard (Daily + 4H)
• Non-repainting EMA (9 / 21) logic
• Color-coded states (Bullish / Bearish / Neutral)
• Lightweight and easy to read
• Adjustable panel position: Top Right / Top Left / Bottom Right / Bottom Left
How to Use
Add the indicator to any chart.
Wait for both timeframes to align before entering trades.
Mixed signals often indicate sideways or transitional markets.
Combine with your existing trading strategy for confirmation.
Trend Condition Glossary
▲ STRONG BULLISH – EMA(9) well above EMA(21) and both sloping upward. Strong upward momentum with price above both EMAs.
BULLISH – EMA(9) above EMA(21) but weaker slope or price confirmation. Moderate uptrend or early recovery.
NEUTRAL – EMAs crossing or flat. Market lacks structure — consolidation or indecision.
▼ BEARISH – EMA(9) below EMA(21) with limited slope. Mild correction or early reversal.
▼ STRONG BEARISH – EMA(9) below EMA(21), both sloping down, price below both. Strong downtrend, clear seller control.
Who It’s For
Traders who want a clean, no-noise confirmation tool to simplify directional bias decisions in swing and intraday setups.
Disclaimer
This indicator is for analytical and educational purposes only. Always trade with discipline, patience, and sound risk management.
보호된 스크립트입니다
이 스크립트는 비공개 소스로 게시됩니다. 하지만 이를 자유롭게 제한 없이 사용할 수 있습니다 – 자세한 내용은 여기에서 확인하세요.
면책사항
해당 정보와 게시물은 금융, 투자, 트레이딩 또는 기타 유형의 조언이나 권장 사항으로 간주되지 않으며, 트레이딩뷰에서 제공하거나 보증하는 것이 아닙니다. 자세한 내용은 이용 약관을 참조하세요.
면책사항
해당 정보와 게시물은 금융, 투자, 트레이딩 또는 기타 유형의 조언이나 권장 사항으로 간주되지 않으며, 트레이딩뷰에서 제공하거나 보증하는 것이 아닙니다. 자세한 내용은 이용 약관을 참조하세요.