INVITE-ONLY SCRIPT
업데이트됨 SMART indicator
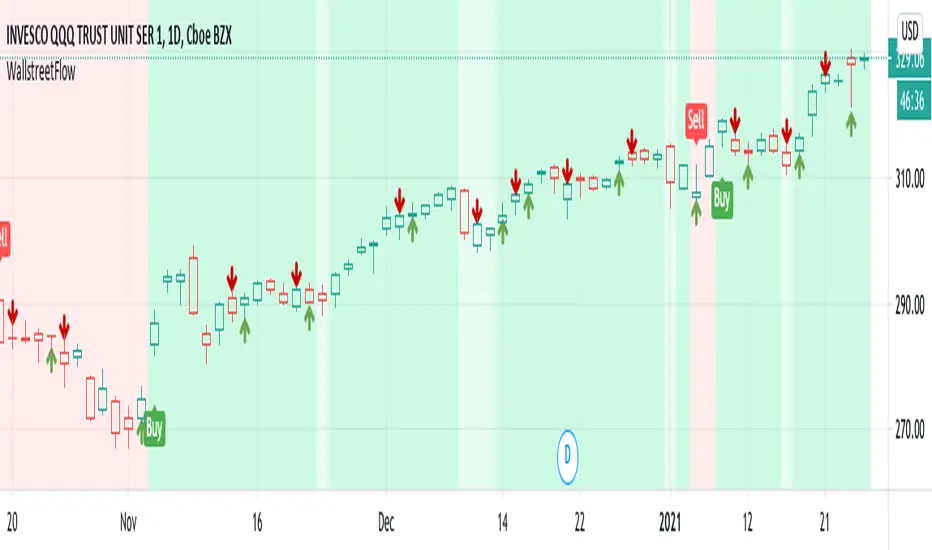
This script combines the usage of the SMA and ATR indicator in order to provide signals for opening and closing trades, either buy or sell signals. It uses SMA and ATR, both configurable by the users.
The trigger of Buy and Sell Signals are calculated through the SMA and ATR:
* Buy Signals: They are highlighted by a dark green background area.
* Sell Signals: They are highlighted by a dark red background area.
The trigger of Close Buy and Close Sell Signals are calculated through current price using SMA and ATR:
* Close Buy Signals: The fast SMA crosses under the close price and at the same time the trend is bullish. They are highlighted by a lighter green area.
* Close Sell Signals: The fast SMA crosses over the close price and at the same time the trend is bearish. They are highlighted by a lighter red area
Few important points about the indicator and the produced signals:
* This is not intended to be a strategy, but an indicator for analyzing the market conditions. It gives you the triggers depending on the real time analysis of the prices, but not being a proper strategy, pay attention about "fake signals" and add always a visual analysis to the provided signals
* Following this indicator, the trade positions should be opened only when background color appears GREEN. Either in this case, analyze the chart in order to see if the signals are "weak" ones, due to "waves" around the SMA . In these cases, you might wait for the next confirmation signals after the waves, when the trend will be better defined
* The close trade signals are provided in order to help to understand when you should close the buy or sell trades. Even in this case, always add a visual analysis to the signals, and pay attention to the support/resistance areas. Sometimes, you can have the close signals in correspondence to support/resistance areas: in these cases wait for the definition of the trend and eventually for the next close trade signals if they will be better defined
Final Notes
* Indicator will show Trend, Pullback, Market bounce and some support and resistance level.
릴리즈 노트
Changed the default value for length of period used to calculate for stop loss. Reduced it to make have a tight stop loss.릴리즈 노트
Changed value of default stop loss from 8 to 2 to increase more aggressive trading.릴리즈 노트
Adding a technical profit/loss points using stochastic rsi. Green arrow is a potential buy point with stop if close below previous candle or some percentage points. Red arrow on green background is profit booking point.릴리즈 노트
Adding one more condition to have a confirmation signal to BUY릴리즈 노트
Corrected script to take only the best method to make it easy for momentum buying. This will ease the way and take only stocks which are in momentum.릴리즈 노트
Changed the script to catch every direction, yellow color is the place to book half profits. Though the setup is not strong buy its worth buying and managing risk.릴리즈 노트
Reverting back to previous changes, though stop loss is big I think it's better from returns point.릴리즈 노트
Changing the default value릴리즈 노트
Making script generic to have only the visual effect by changing colors. Removing the stochastic overbought level indication.릴리즈 노트
Added BUY/SELL labels to work on dark themes초대 전용 스크립트
이 스크립트는 작성자가 승인한 사용자만 접근할 수 있습니다. 사용하려면 요청 후 승인을 받아야 하며, 일반적으로 결제 후에 허가가 부여됩니다. 자세한 내용은 아래 작성자의 안내를 따르거나 WallStreetFlow에게 직접 문의하세요.
트레이딩뷰는 스크립트의 작동 방식을 충분히 이해하고 작성자를 완전히 신뢰하지 않는 이상, 해당 스크립트에 비용을 지불하거나 사용하는 것을 권장하지 않습니다. 커뮤니티 스크립트에서 무료 오픈소스 대안을 찾아보실 수도 있습니다.
작성자 지시 사항
면책사항
해당 정보와 게시물은 금융, 투자, 트레이딩 또는 기타 유형의 조언이나 권장 사항으로 간주되지 않으며, 트레이딩뷰에서 제공하거나 보증하는 것이 아닙니다. 자세한 내용은 이용 약관을 참조하세요.
초대 전용 스크립트
이 스크립트는 작성자가 승인한 사용자만 접근할 수 있습니다. 사용하려면 요청 후 승인을 받아야 하며, 일반적으로 결제 후에 허가가 부여됩니다. 자세한 내용은 아래 작성자의 안내를 따르거나 WallStreetFlow에게 직접 문의하세요.
트레이딩뷰는 스크립트의 작동 방식을 충분히 이해하고 작성자를 완전히 신뢰하지 않는 이상, 해당 스크립트에 비용을 지불하거나 사용하는 것을 권장하지 않습니다. 커뮤니티 스크립트에서 무료 오픈소스 대안을 찾아보실 수도 있습니다.
작성자 지시 사항
면책사항
해당 정보와 게시물은 금융, 투자, 트레이딩 또는 기타 유형의 조언이나 권장 사항으로 간주되지 않으며, 트레이딩뷰에서 제공하거나 보증하는 것이 아닙니다. 자세한 내용은 이용 약관을 참조하세요.