OPEN-SOURCE SCRIPT
업데이트됨 Debug tool - table
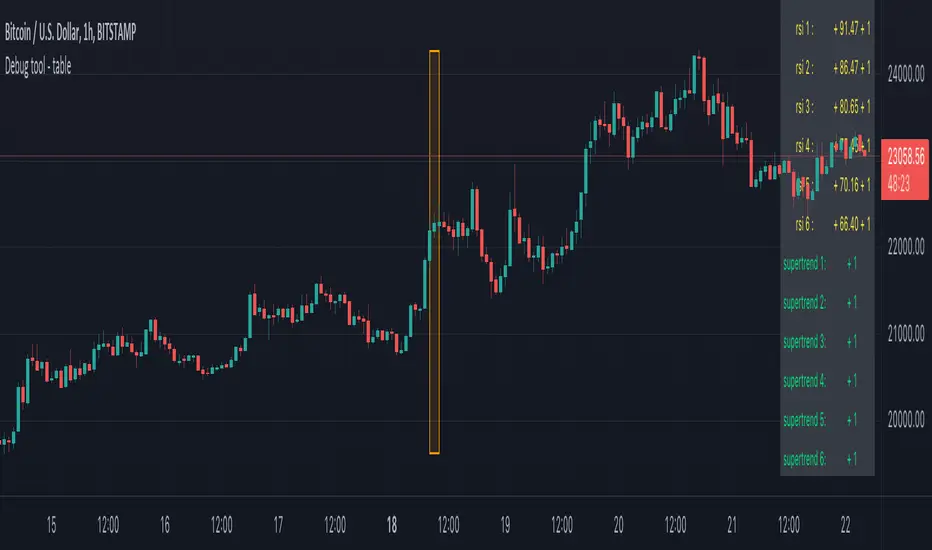
When having a script with lot's of values, it can be difficult to seek the values you need to debug
For example, here, multiple values aren't visible anymore (right side chart)

————————————————————————————————————————————————————————————————
This script show a way where you can show the values in a table on 1 particular bar, with 2 options:
1)
'middle' -> here the script uses chart.left_visible_bar_time and chart.right_visible_bar_time to calculate the middle
the values of that bar (in orange box) is shown, you can check the value by putting your mouse cursor on that bar:

Just zooming in/out, or scrolling through history will automatically show you the middle and the values of that bar.
Using the arrows on your keyboard will allow you to go 1 bar further/back each time.
(Give it some time to load though, also, sometimes you need to click anywhere on the chart before arrows start working)
2)
'time' -> settings -> Date -> the orange bar will be placed on the chosen bar, the values will be placed in the table as well.
————————————————————————————————————————————————————————————————
If the table interfere with the candles, you can alter the position without changing the placement of the orange bar -> settings -> position table
This script holds lots of values, just to show the difference between values placed on the chart, and values, placed in the table.
To make more clear how the script works, an 'example' (v_rsi1 / rsi1) is highlighted in the code itself
Cheers!
For example, here, multiple values aren't visible anymore (right side chart)
————————————————————————————————————————————————————————————————
This script show a way where you can show the values in a table on 1 particular bar, with 2 options:
1)
'middle' -> here the script uses chart.left_visible_bar_time and chart.right_visible_bar_time to calculate the middle
the values of that bar (in orange box) is shown, you can check the value by putting your mouse cursor on that bar:
Just zooming in/out, or scrolling through history will automatically show you the middle and the values of that bar.
Using the arrows on your keyboard will allow you to go 1 bar further/back each time.
(Give it some time to load though, also, sometimes you need to click anywhere on the chart before arrows start working)
2)
'time' -> settings -> Date -> the orange bar will be placed on the chosen bar, the values will be placed in the table as well.
————————————————————————————————————————————————————————————————
If the table interfere with the candles, you can alter the position without changing the placement of the orange bar -> settings -> position table
This script holds lots of values, just to show the difference between values placed on the chart, and values, placed in the table.
To make more clear how the script works, an 'example' (v_rsi1 / rsi1) is highlighted in the code itself
Cheers!
릴리즈 노트
––––––––––––––––––––––––––––––––––––––––––––––––––––––––––––––––––––This script is part of a collection of educational scripts
If you want to return to the open source INDEX page, click here
-> Education: INDEX
오픈 소스 스크립트
트레이딩뷰의 진정한 정신에 따라, 이 스크립트의 작성자는 이를 오픈소스로 공개하여 트레이더들이 기능을 검토하고 검증할 수 있도록 했습니다. 작성자에게 찬사를 보냅니다! 이 코드는 무료로 사용할 수 있지만, 코드를 재게시하는 경우 하우스 룰이 적용된다는 점을 기억하세요.
Who are PineCoders?
tradingview.com/chart/SSP/yW5eOqtm-Who-are-PineCoders/
TG Pine Script® Q&A: t.me/PineCodersQA
- We cannot control our emotions,
but we can control our keyboard -
tradingview.com/chart/SSP/yW5eOqtm-Who-are-PineCoders/
TG Pine Script® Q&A: t.me/PineCodersQA
- We cannot control our emotions,
but we can control our keyboard -
면책사항
해당 정보와 게시물은 금융, 투자, 트레이딩 또는 기타 유형의 조언이나 권장 사항으로 간주되지 않으며, 트레이딩뷰에서 제공하거나 보증하는 것이 아닙니다. 자세한 내용은 이용 약관을 참조하세요.