OPEN-SOURCE SCRIPT
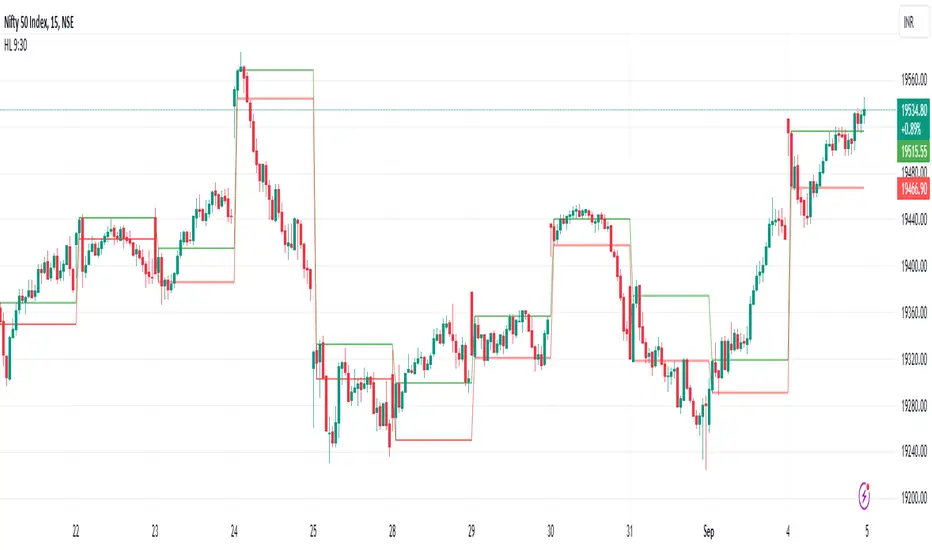
HL 930 by JP

The "High and Low of 9:30 Candle" strategy is a simple trading strategy commonly used in the stock market and other financial markets. It involves using the price range (high and low) of the first candlestick that forms at the opening of a trading session, typically at 9:30 AM, as a basis for making trading decisions. Here's a description of this strategy:
1. Timeframe: This strategy is often applied to intraday trading, where traders focus on short-term price movements within a single trading day.
2. 9:30 AM Candle: The strategy begins by observing the first candlestick that forms at 9:30 AM, which is the opening time for many stock markets, including the New York Stock Exchange (NYSE). This candle represents the price action during the first few minutes of trading.
3. High and Low: Identify the highest price (the candle's high) and the lowest price (the candle's low) during the 9:30 AM candle's time period. These price levels are critical for the strategy.
4. Trading Decisions:
Long (Buy) Signal: If the current market price breaks above the high of the 9:30 AM candle, it may trigger a bullish signal. Traders may consider entering a long (buy) position, anticipating further upward momentum.
Short (Sell) Signal: Conversely, if the market price breaks below the low of the 9:30 AM candle, it may trigger a bearish signal. Traders may consider entering a short (sell) position, anticipating further downward movement.
5. Stop-Loss and Take-Profit: To manage risk, traders often set stop-loss orders just below the low (for long positions) or just above the high (for short positions) of the 9:30 AM candle. They may also establish take-profit levels based on their risk-reward preferences.
6. Time Frame: This strategy is typically used for short-term trading and may be effective in capturing quick price movements that often occur at the market open. Traders often close their positions before the end of the trading day.
7. Caution: While the "High and Low of 9:30 Candle" strategy can be straightforward, it should not be used in isolation. Traders should consider other technical and fundamental factors, such as volume, market sentiment, news events, and overall market trends, when making trading decisions.
Remember that trading strategies always carry risks, and it's essential to have a well-thought-out risk management plan in place. Additionally, backtesting and practice are crucial before implementing any trading strategy in a live market to evaluate its historical performance and suitability for your trading style.
오픈 소스 스크립트
트레이딩뷰의 진정한 정신에 따라, 이 스크립트의 작성자는 이를 오픈소스로 공개하여 트레이더들이 기능을 검토하고 검증할 수 있도록 했습니다. 작성자에게 찬사를 보냅니다! 이 코드는 무료로 사용할 수 있지만, 코드를 재게시하는 경우 하우스 룰이 적용된다는 점을 기억하세요.
면책사항
해당 정보와 게시물은 금융, 투자, 트레이딩 또는 기타 유형의 조언이나 권장 사항으로 간주되지 않으며, 트레이딩뷰에서 제공하거나 보증하는 것이 아닙니다. 자세한 내용은 이용 약관을 참조하세요.
오픈 소스 스크립트
트레이딩뷰의 진정한 정신에 따라, 이 스크립트의 작성자는 이를 오픈소스로 공개하여 트레이더들이 기능을 검토하고 검증할 수 있도록 했습니다. 작성자에게 찬사를 보냅니다! 이 코드는 무료로 사용할 수 있지만, 코드를 재게시하는 경우 하우스 룰이 적용된다는 점을 기억하세요.
면책사항
해당 정보와 게시물은 금융, 투자, 트레이딩 또는 기타 유형의 조언이나 권장 사항으로 간주되지 않으며, 트레이딩뷰에서 제공하거나 보증하는 것이 아닙니다. 자세한 내용은 이용 약관을 참조하세요.