PROTECTED SOURCE SCRIPT
업데이트됨 CCI heatmap(15-170)
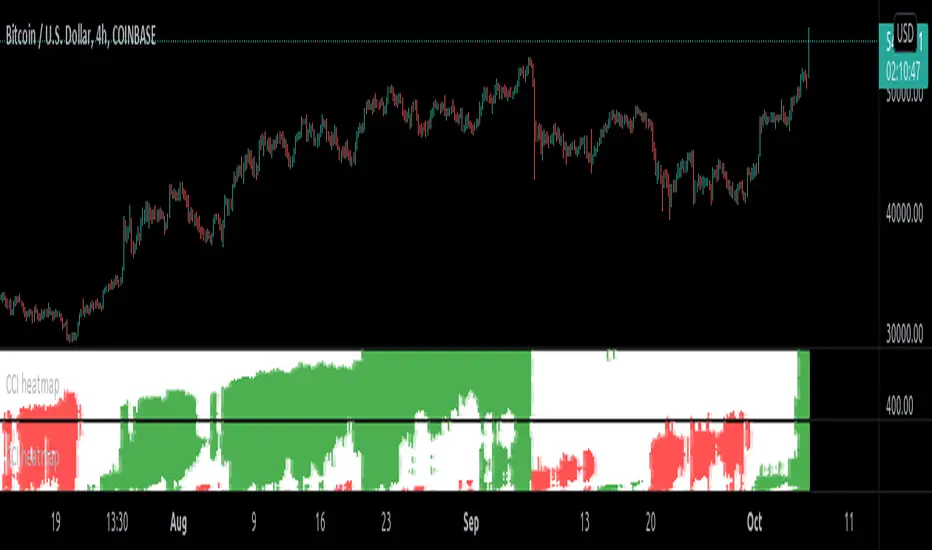
This is CCI (Commodity channel index) heatmap for the period lengths (15 to 170).
How to use :
1.) When overwhelming green appears, it means price is supposed to be trending up.
2.) When white appears, it means price is supposed to be neutral.
3.) When overwhelming red appears, it means price is supposed to be trending down.
Note: This indicator is supposed to be used with CCI heatmap(175-330) and CCI heatmap(335-490) aligned in increasing order of period lengths for higher resolution of period lengths. Otherwise use CCI heatmap(low resolution) indicator in which these 3 high resolution indicator is adjusted to a single indicator.
(Expect remaining indicator to be published to the public in mid of march 2021)
릴리즈 노트
Expanded the current script from input lengths (15-170) to now (20-330). Therefore no need of multiple instances/resolutions of same indicator.릴리즈 노트
This is advanced version of CCI ( Commodity channel index ) heatmap .
Add 2 instances of same indicator and put 'set2 lengths' above 'set1 lengths' (align in increasing order of period lengths) to get continuous pattern for larger picture otherwise you can always use just default set1 as well .
How to use :
1.) When overwhelming green appears, it means price is supposed to be trending up.
2.) When overwhelming red appears, it means price is supposed to be trending down.
3.) When white appears, it means price is currently neutral , at this point get ready and expect a breakout in either direction . In other words overwhelming white suggest asset is currently highly compressed(fuel in the tank) and expected to expand(burn the fuel) in either direction .
Did you know : CCI resembles Bollinger bands with 1.25 standard deviation . In CCI +100 and -100 resembles upper and lower band of bollinger band with 1.25 standard deviation (multi).
보호된 스크립트입니다
이 스크립트는 비공개 소스로 게시됩니다. 하지만 이를 자유롭게 제한 없이 사용할 수 있습니다 – 자세한 내용은 여기에서 확인하세요.
면책사항
해당 정보와 게시물은 금융, 투자, 트레이딩 또는 기타 유형의 조언이나 권장 사항으로 간주되지 않으며, 트레이딩뷰에서 제공하거나 보증하는 것이 아닙니다. 자세한 내용은 이용 약관을 참조하세요.
보호된 스크립트입니다
이 스크립트는 비공개 소스로 게시됩니다. 하지만 이를 자유롭게 제한 없이 사용할 수 있습니다 – 자세한 내용은 여기에서 확인하세요.
면책사항
해당 정보와 게시물은 금융, 투자, 트레이딩 또는 기타 유형의 조언이나 권장 사항으로 간주되지 않으며, 트레이딩뷰에서 제공하거나 보증하는 것이 아닙니다. 자세한 내용은 이용 약관을 참조하세요.