OPEN-SOURCE SCRIPT
업데이트됨 Mayer Multiple Dynamic Histogram [arviman]
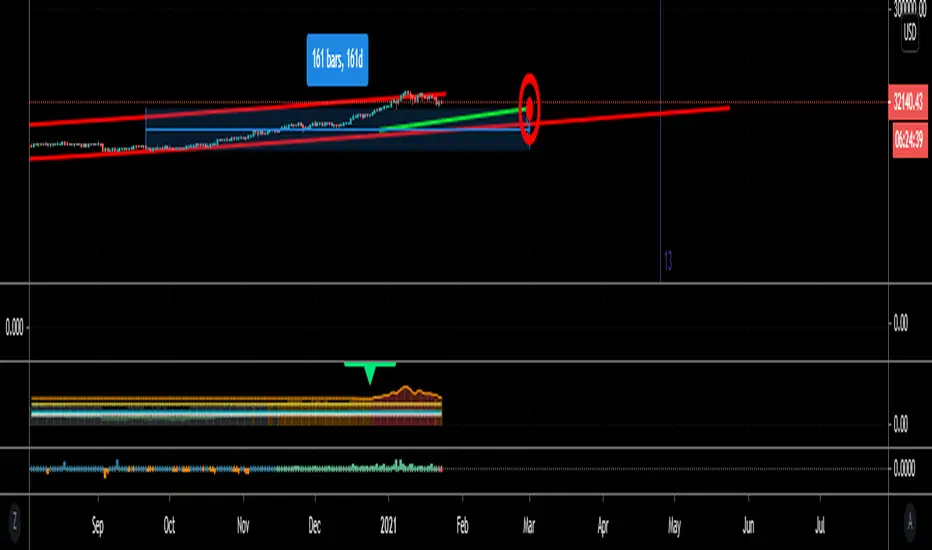
Plots dynamic levels of the standard mayer multiple based on percentile of recent history. This allows you to view color coded information in a more dynamic fashion.
Hope this helps give you an overview of the current market.
This can be used for crypto but also for quick analysis of the current trend for any other instruments like stocks.
Hope this helps give you an overview of the current market.
This can be used for crypto but also for quick analysis of the current trend for any other instruments like stocks.
릴리즈 노트
upgrade to v4, added an SMA display릴리즈 노트
updated step size오픈 소스 스크립트
트레이딩뷰의 진정한 정신에 따라, 이 스크립트의 작성자는 이를 오픈소스로 공개하여 트레이더들이 기능을 검토하고 검증할 수 있도록 했습니다. 작성자에게 찬사를 보냅니다! 이 코드는 무료로 사용할 수 있지만, 코드를 재게시하는 경우 하우스 룰이 적용된다는 점을 기억하세요.
면책사항
해당 정보와 게시물은 금융, 투자, 트레이딩 또는 기타 유형의 조언이나 권장 사항으로 간주되지 않으며, 트레이딩뷰에서 제공하거나 보증하는 것이 아닙니다. 자세한 내용은 이용 약관을 참조하세요.
오픈 소스 스크립트
트레이딩뷰의 진정한 정신에 따라, 이 스크립트의 작성자는 이를 오픈소스로 공개하여 트레이더들이 기능을 검토하고 검증할 수 있도록 했습니다. 작성자에게 찬사를 보냅니다! 이 코드는 무료로 사용할 수 있지만, 코드를 재게시하는 경우 하우스 룰이 적용된다는 점을 기억하세요.
면책사항
해당 정보와 게시물은 금융, 투자, 트레이딩 또는 기타 유형의 조언이나 권장 사항으로 간주되지 않으며, 트레이딩뷰에서 제공하거나 보증하는 것이 아닙니다. 자세한 내용은 이용 약관을 참조하세요.