OPEN-SOURCE SCRIPT
업데이트됨 Fisher Multi-Pack [DW]
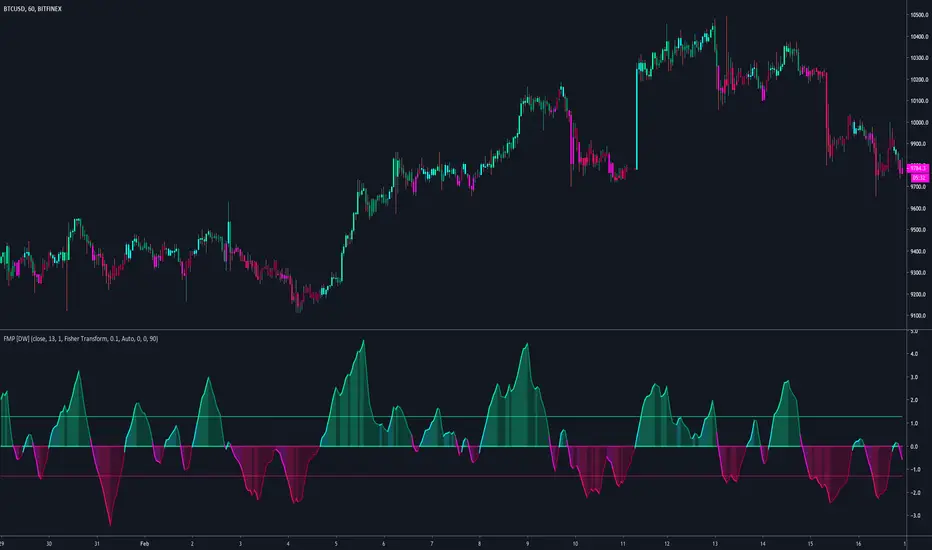
This is an experimental study designed to visualize price activity using John Ehlers Fisher Transform and Inverse Fisher Transform methods.
The Ehlers Fisher Transform is a variation of R. A. Fisher's Z transformation.
In this study, there are five oscillator types to choose from:
-Fisher Transform Indicator - A conversion of price's probability distribution to a Gaussian normal distribution with a smoother output
-Inverse Fisher Relative Strength Index - Converts the RSI's distribution to a bounded distribution between 1 and -1 with a smoother output
-Inverse Fisher Stochastic Oscillator - Converts the Stochastic's distribution to a bounded distribution between 1 and -1 with a smoother output
-Inverse Fisher Commodity Channel Index - Converts the CCI's distribution to a bounded distribution between 1 and -1 with a smoother output
-Inverse Fisher Blast Off Momentum - Converts the BOM's distribution to a bounded distribution between 1 and -1 with a smoother output
The study uses a modified set of Bollinger Bands applied to the chosen oscillator to determine trend and impulse activity, which are highlighted by the color scheme.
Custom bar colors are included.
릴리즈 노트
Updates:Cleaned up the script. Removed clutter.
Removed Inverse Fisher BOM from the oscillator types due to an excessive amount of false readings.
Thresholds are no longer Bollinger Bands. Instead, they are calculated using a cumulative average of the oscillator's deviation from 0.
Minor aesthetic changes.
릴리즈 노트
Updates:-> Reorganized script structure.
-> Main calculations are now expressed as functions.
-> Added custom threshold inputs.
-> Added an option to compress the oscillator around thresholds by a specified level of intensity. (Most useful with Fisher Transform oscillator type.)
-> Revamped color scheme.
오픈 소스 스크립트
트레이딩뷰의 진정한 정신에 따라, 이 스크립트의 작성자는 이를 오픈소스로 공개하여 트레이더들이 기능을 검토하고 검증할 수 있도록 했습니다. 작성자에게 찬사를 보냅니다! 이 코드는 무료로 사용할 수 있지만, 코드를 재게시하는 경우 하우스 룰이 적용된다는 점을 기억하세요.
For my full list of premium tools, check the blog:
wallanalytics.com/
Reach out on Telegram:
t.me/DonovanWall
wallanalytics.com/
Reach out on Telegram:
t.me/DonovanWall
면책사항
해당 정보와 게시물은 금융, 투자, 트레이딩 또는 기타 유형의 조언이나 권장 사항으로 간주되지 않으며, 트레이딩뷰에서 제공하거나 보증하는 것이 아닙니다. 자세한 내용은 이용 약관을 참조하세요.