OPEN-SOURCE SCRIPT
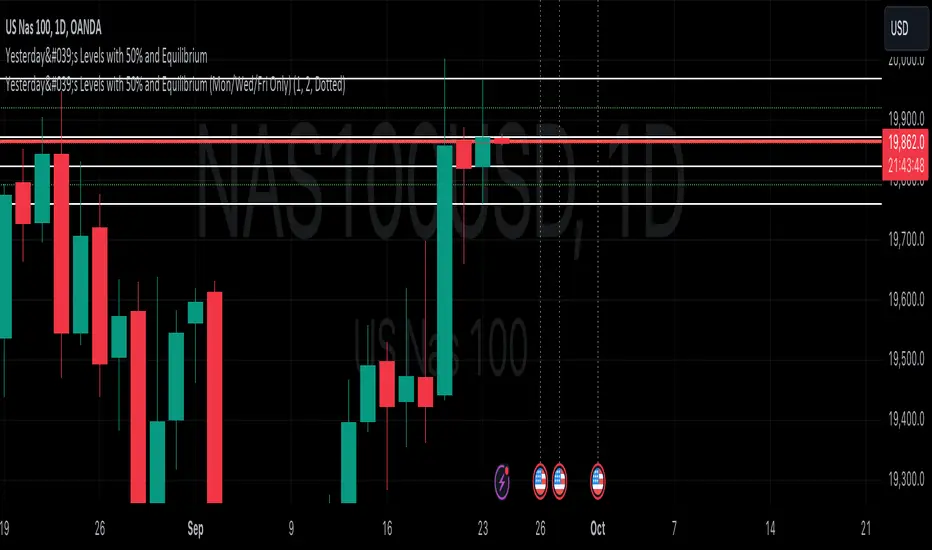
업데이트됨 Yesterday's Levels with 50% wick and Equilibrium
## Script Description
This Pine Script indicator highlights key levels from the previous day’s daily candle on any timeframe chart. It focuses exclusively on marking the following:
1. **Previous Day’s High, Low, Open, and Close**:
- Horizontal lines are drawn to indicate the previous day's high, low, open, and close prices.
- These lines are white and extend across the chart.
2. **50% of Candle Wicks**:
- If the previous day’s candle has wicks, two additional lines mark 50% of the top wick and 50% of the bottom wick.
- These lines are green and dotted, representing half the wick’s height.
3. **Equilibrium (50% of the Full Candle)**:
- A horizontal red line marks the midpoint (equilibrium) of the entire previous day’s candle, from high to low.
- This line is thicker than the others to emphasize the equilibrium level.
The script works by focusing only on the previous day’s daily candle, ensuring that it doesn’t plot lines for any older candles. These levels are visible on all timeframes.
릴리즈 노트
# Indicator: "Yesterday's Levels with 50% and Equilibrium"This indicator helps traders by automatically plotting key levels from the previous day's candle on their charts. It provides a clear visual reference to important price levels that can be used for making trading decisions on any timeframe. The following key features are included:
### 1. Previous Day's High, Low, Open, and Close:
- Horizontal lines mark the high, low, open, and close of the previous day's candle, providing quick visual access to these key levels.
- These levels are drawn in white and extend across all future bars, making them easy to see no matter which timeframe you're viewing.
### 2. Equilibrium Level:
- A red, thick horizontal line marks the "equilibrium" or 50% level of the previous day's entire range (from high to low). This level is often used by traders to gauge potential reversal or continuation zones.
### 3. 50% Wick Levels:
- Green dotted lines represent the 50% level of the upper and lower wicks of the previous day's candle. These lines can help identify potential reaction areas within the day's price action.
The indicator is designed to work on all timeframes but only calculates levels based on the previous day’s candle from the daily timeframe. This makes it particularly useful for intraday and swing traders who want to keep track of the prior day's price action.
릴리즈 노트
Marks the previous day high, low, open and close of a candle. Tha script runs on Monday, Tuesday and Fridays. 오픈 소스 스크립트
트레이딩뷰의 진정한 정신에 따라, 이 스크립트의 작성자는 이를 오픈소스로 공개하여 트레이더들이 기능을 검토하고 검증할 수 있도록 했습니다. 작성자에게 찬사를 보냅니다! 이 코드는 무료로 사용할 수 있지만, 코드를 재게시하는 경우 하우스 룰이 적용된다는 점을 기억하세요.
면책사항
해당 정보와 게시물은 금융, 투자, 트레이딩 또는 기타 유형의 조언이나 권장 사항으로 간주되지 않으며, 트레이딩뷰에서 제공하거나 보증하는 것이 아닙니다. 자세한 내용은 이용 약관을 참조하세요.
오픈 소스 스크립트
트레이딩뷰의 진정한 정신에 따라, 이 스크립트의 작성자는 이를 오픈소스로 공개하여 트레이더들이 기능을 검토하고 검증할 수 있도록 했습니다. 작성자에게 찬사를 보냅니다! 이 코드는 무료로 사용할 수 있지만, 코드를 재게시하는 경우 하우스 룰이 적용된다는 점을 기억하세요.
면책사항
해당 정보와 게시물은 금융, 투자, 트레이딩 또는 기타 유형의 조언이나 권장 사항으로 간주되지 않으며, 트레이딩뷰에서 제공하거나 보증하는 것이 아닙니다. 자세한 내용은 이용 약관을 참조하세요.