OPEN-SOURCE SCRIPT
SB_Wavetrend_Oscillator
A take on LazyBear's Wavetrend_Oscillator
The idea is bit modified.
Original Idea:
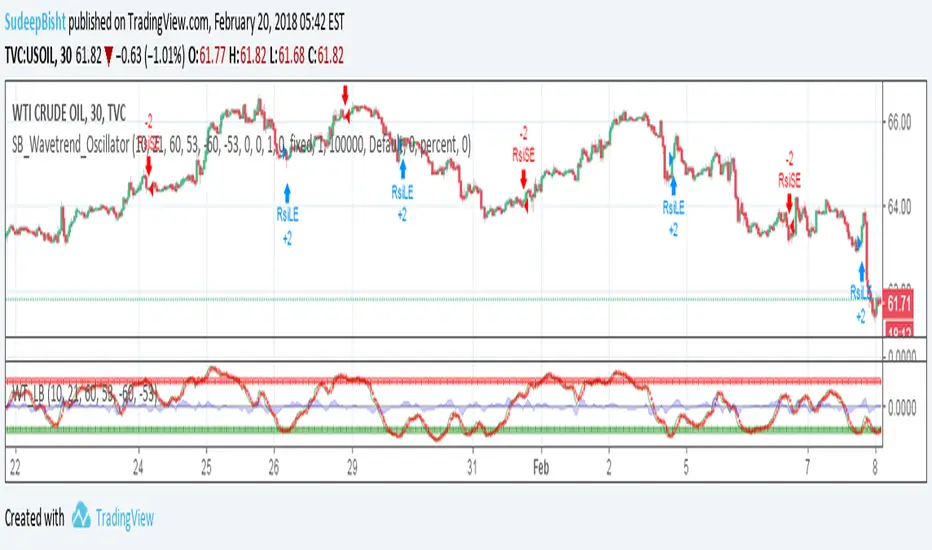
When the oscillator is above the overbought band (red lines) and crosses down the signal (dotted line), it is usually a good SELL signal. Similarly, when the oscillator crosses above the signal when below the Oversold band (green lines), it is a good BUY signal.
Modified Idea:
Carrying the original idea, if the oscillator crosses the overbought band (red lines) and crosses down the signal (dotted line) twice without crossing the Oversold band (green lines) and crosses above the signal (dotted line), a buy or sell signal will take place when the oscillator crosses the dotted line and the value of oscillator is >0(if sell order is to be placed) and <0(if buy order is to be placed).
For the original idea you can refer to:
![Indicator: WaveTrend Oscillator [WT]](https://s3.tradingview.com/2/2KE8wTuF_mid.png)
Let me know if any refinements could improve the oscillator.
The idea is bit modified.
Original Idea:
When the oscillator is above the overbought band (red lines) and crosses down the signal (dotted line), it is usually a good SELL signal. Similarly, when the oscillator crosses above the signal when below the Oversold band (green lines), it is a good BUY signal.
Modified Idea:
Carrying the original idea, if the oscillator crosses the overbought band (red lines) and crosses down the signal (dotted line) twice without crossing the Oversold band (green lines) and crosses above the signal (dotted line), a buy or sell signal will take place when the oscillator crosses the dotted line and the value of oscillator is >0(if sell order is to be placed) and <0(if buy order is to be placed).
For the original idea you can refer to:
Let me know if any refinements could improve the oscillator.
오픈 소스 스크립트
트레이딩뷰의 진정한 정신에 따라, 이 스크립트의 작성자는 이를 오픈소스로 공개하여 트레이더들이 기능을 검토하고 검증할 수 있도록 했습니다. 작성자에게 찬사를 보냅니다! 이 코드는 무료로 사용할 수 있지만, 코드를 재게시하는 경우 하우스 룰이 적용된다는 점을 기억하세요.
면책사항
해당 정보와 게시물은 금융, 투자, 트레이딩 또는 기타 유형의 조언이나 권장 사항으로 간주되지 않으며, 트레이딩뷰에서 제공하거나 보증하는 것이 아닙니다. 자세한 내용은 이용 약관을 참조하세요.
오픈 소스 스크립트
트레이딩뷰의 진정한 정신에 따라, 이 스크립트의 작성자는 이를 오픈소스로 공개하여 트레이더들이 기능을 검토하고 검증할 수 있도록 했습니다. 작성자에게 찬사를 보냅니다! 이 코드는 무료로 사용할 수 있지만, 코드를 재게시하는 경우 하우스 룰이 적용된다는 점을 기억하세요.
면책사항
해당 정보와 게시물은 금융, 투자, 트레이딩 또는 기타 유형의 조언이나 권장 사항으로 간주되지 않으며, 트레이딩뷰에서 제공하거나 보증하는 것이 아닙니다. 자세한 내용은 이용 약관을 참조하세요.