OPEN-SOURCE SCRIPT
업데이트됨 ADMA
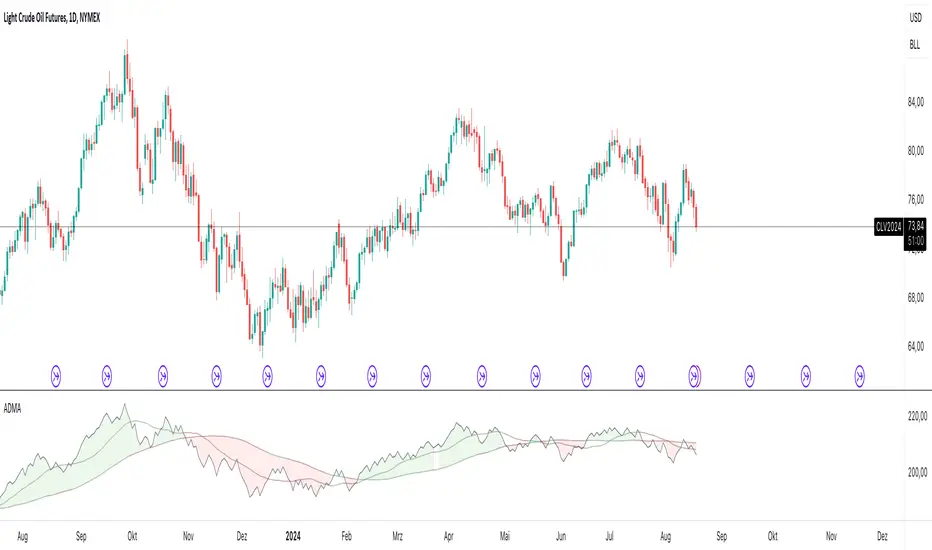
The ADMA indicator is a technical analysis tool designed to identify trends and potential reversal points in a financial market. The indicator is based on the cumulative difference between the closing price and the high and low points of a candle. Two moving averages (MAs) are used to smooth the trend dynamics and generate clear signals.
Calculation:
The indicator calculates the trend as the cumulative difference between the current closing price and the maximum (or minimum) value of the current and previous candle, depending on market development.
The ADMA indicator is particularly useful for recognizing market dynamics and making trading decisions based on them. By using double smoothing, false signals are reduced, and the signals generated by the indicator are clear and easy to interpret. It is a flexible tool that can be adapted to different trading strategies.
릴리즈 노트
Calculation Methodology:MaxCloseHigh and MinCloseLow:
MaxCloseHigh: Computes the higher value between the closing price (close) and the high price (high) of the current candle.
MinCloseLow: Determines the lower value between the closing price (close) and the low price (low) of the current candle.
Price Difference (priceDifference):
If the current closing price is higher than the previous closing price, the difference between the closing price and the low price (minCloseLow) is calculated.
If the current closing price is lower than the previous closing price, the difference between the closing price and the high price (maxCloseHigh) is calculated.
Cumulative Trend Calculation (cumulativeTrend):
The price difference (priceDifference) is aggregated over time to form a cumulative trend value, which represents the accumulated price movement.
Moving Average of the Trend:
SmoothedTrend: A Simple Moving Average (SMA) applied to the cumulative trend over a defined period (maLength) to smooth the trend and reduce noise.
SmoothedMidTrend: Another SMA applied to the cumulative trend over a shorter period (midMaLength) to allow for quicker response to changes in trend dynamics.
Applications and Use Cases:
Identifying Divergences:
The ADMA indicator excels at detecting divergences between price movements and the indicator itself. Divergences can serve as strong signals for potential trend reversals.
Bullish Divergence: When the price forms lower lows while the ADMA forms higher lows, suggesting a potential upward reversal.
Bearish Divergence: When the price makes higher highs while the ADMA forms lower highs, indicating a possible downward reversal.
How to Spot Divergences: Draw lines connecting two significant points on the price chart and compare them with corresponding points on the ADMA. Deviations between these lines indicate a divergence.
Assessing Market Conditions:
The smoothed line of the ADMA makes it easier to evaluate the current market environment.
Bullish Market: When the cumulativeTrend is above the smoothed trend, it signals a bullish market environment.
Bearish Market: When the cumulativeTrend is below the smoothed trend, it likely indicates a bearish market environment.
오픈 소스 스크립트
트레이딩뷰의 진정한 정신에 따라, 이 스크립트의 작성자는 이를 오픈소스로 공개하여 트레이더들이 기능을 검토하고 검증할 수 있도록 했습니다. 작성자에게 찬사를 보냅니다! 이 코드는 무료로 사용할 수 있지만, 코드를 재게시하는 경우 하우스 룰이 적용된다는 점을 기억하세요.
면책사항
해당 정보와 게시물은 금융, 투자, 트레이딩 또는 기타 유형의 조언이나 권장 사항으로 간주되지 않으며, 트레이딩뷰에서 제공하거나 보증하는 것이 아닙니다. 자세한 내용은 이용 약관을 참조하세요.
오픈 소스 스크립트
트레이딩뷰의 진정한 정신에 따라, 이 스크립트의 작성자는 이를 오픈소스로 공개하여 트레이더들이 기능을 검토하고 검증할 수 있도록 했습니다. 작성자에게 찬사를 보냅니다! 이 코드는 무료로 사용할 수 있지만, 코드를 재게시하는 경우 하우스 룰이 적용된다는 점을 기억하세요.
면책사항
해당 정보와 게시물은 금융, 투자, 트레이딩 또는 기타 유형의 조언이나 권장 사항으로 간주되지 않으며, 트레이딩뷰에서 제공하거나 보증하는 것이 아닙니다. 자세한 내용은 이용 약관을 참조하세요.