OPEN-SOURCE SCRIPT
Ruptura + EMAs + VWAP + Vela Impulsiva
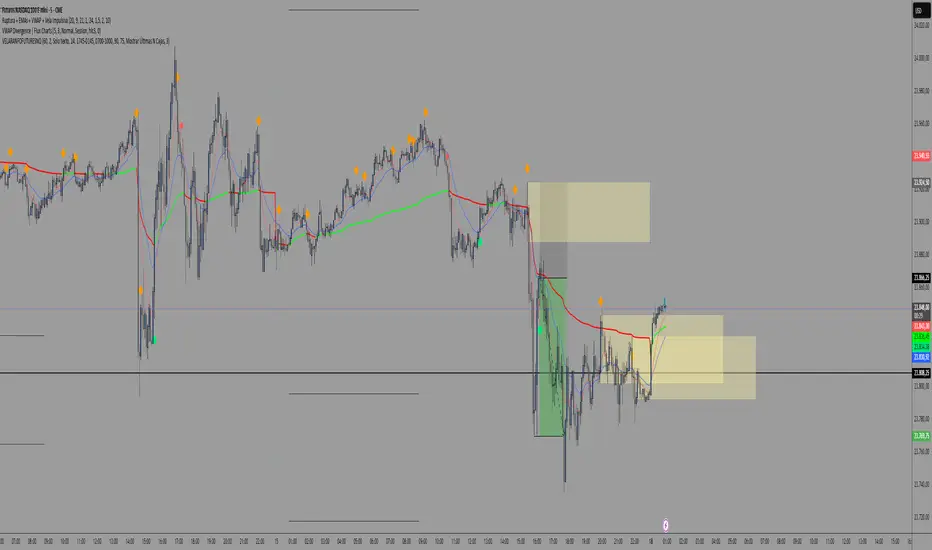
Indicator: Breakout + EMAs + VWAP + Impulsive Candle + TP/SL
This indicator is designed to identify breakout trading opportunities by combining price action, moving averages, volume-weighted price, and impulsive candles, with clearly defined Take Profit (TP) and Stop Loss (SL) levels.
⏱️ Timeframe Logic:
The 15-minute chart is used to define the price range.
Entries are made on the 2-minute chart when breakout conditions align with momentum confirmation.
📌 Key Components:
Range Definition:
Calculates a price range based on a customizable number of candles (rangeBars), typically from the 15-minute timeframe.
Displays a shaded box highlighting this range.
Trend Filters:
Uses a fast EMA (9) and a slow EMA (21) to determine short-term and medium-term trends.
Includes VWAP as a dynamic support/resistance and directional filter.
Only allows trades when both EMAs and price confirm alignment above (for long) or below (for short) the VWAP.
Impulsive Candle Detection:
Confirms breakouts using large-bodied candles that engulf the previous candle's range.
The candle must exceed a certain multiple of the average range (minRangeMult) to qualify.
Breakout Entry Conditions:
Long Setup: Price breaks above the range high, with EMAs and VWAP confirming bullish alignment, and confirmed by an impulsive candle.
Short Setup: Price breaks below the range low, with EMAs and VWAP aligned bearishly, confirmed by an impulsive candle.
Trade Management:
Automatically plots Take Profit and Stop Loss levels based on the size of the entry candle and a customizable TP multiplier.
Visual dashed lines indicate TP (green) and SL (red) zones.
Session Filter:
Entry signals are limited to a specific time window (e.g., 9:00 to 10:00 AM New York time), typically during the NY session open.
Visual Aids:
Background color highlights potential entry zones (green for long, red for short).
Icons mark confirmed impulsive candles and entry signals.
Range box is updated periodically to reflect the active breakout zone.
Script de código abierto
Siguiendo fielmente el espíritu de TradingView, el creador de este script lo ha publicado en código abierto, permitiendo que otros traders puedan revisar y verificar su funcionalidad. ¡Enhorabuena al autor! Puede utilizarlo de forma gratuita, pero tenga en cuenta que la publicación de este código está sujeta a nuestras Normas internas.
오픈 소스 스크립트
트레이딩뷰의 진정한 정신에 따라, 이 스크립트의 작성자는 이를 오픈소스로 공개하여 트레이더들이 기능을 검토하고 검증할 수 있도록 했습니다. 작성자에게 찬사를 보냅니다! 이 코드는 무료로 사용할 수 있지만, 코드를 재게시하는 경우 하우스 룰이 적용된다는 점을 기억하세요.
면책사항
해당 정보와 게시물은 금융, 투자, 트레이딩 또는 기타 유형의 조언이나 권장 사항으로 간주되지 않으며, 트레이딩뷰에서 제공하거나 보증하는 것이 아닙니다. 자세한 내용은 이용 약관을 참조하세요.
오픈 소스 스크립트
트레이딩뷰의 진정한 정신에 따라, 이 스크립트의 작성자는 이를 오픈소스로 공개하여 트레이더들이 기능을 검토하고 검증할 수 있도록 했습니다. 작성자에게 찬사를 보냅니다! 이 코드는 무료로 사용할 수 있지만, 코드를 재게시하는 경우 하우스 룰이 적용된다는 점을 기억하세요.
면책사항
해당 정보와 게시물은 금융, 투자, 트레이딩 또는 기타 유형의 조언이나 권장 사항으로 간주되지 않으며, 트레이딩뷰에서 제공하거나 보증하는 것이 아닙니다. 자세한 내용은 이용 약관을 참조하세요.