OPEN-SOURCE SCRIPT
업데이트됨 Brown's Exponential Smoothing (BES)
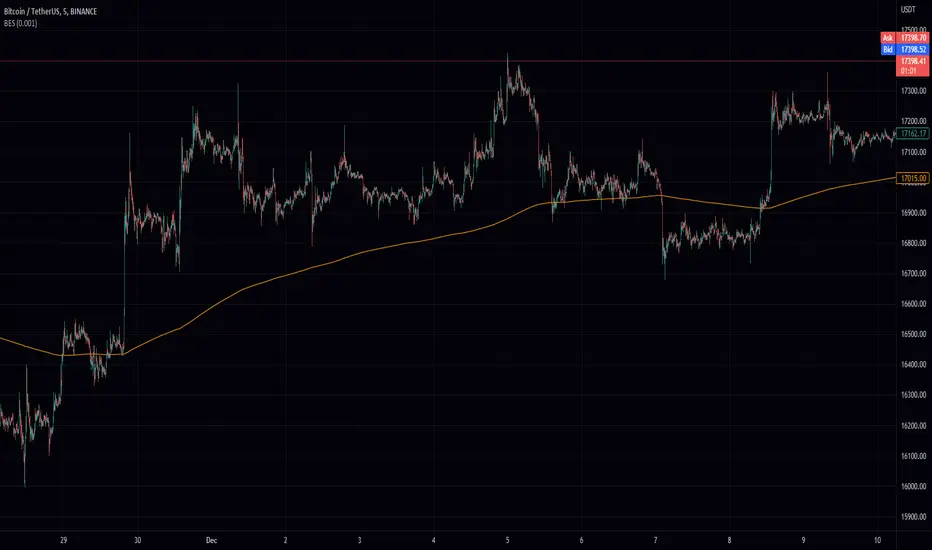
The Brown's Exponential Smoothing indicator is a smoothing function that uses an exponentially weighted moving average to filter the input data. The "alpha" parameter controls the degree of smoothing, with a smaller value resulting in more smoothing and a larger value resulting in less smoothing.
The indicator is implemented as a function, bes, which takes two arguments: source and alpha. The source argument specifies the input data to be smoothed, and the alpha argument specifies the degree of smoothing. The default value for alpha is 0.7, but it can be modified by the user using an input field.
The bes function calculates a smoothed value using the current value of the input data and the previously calculated smoothed value, and updates the value of the smoothed data. This process is repeated for each data point in the input data, resulting in a smoothed version of the data.
The resulting smoothed data is then plotted on the chart using the plot function.
The "BES" indicator can be useful for smoothing noisy or volatile data and making trends in the data more discernible. It may be particularly useful in situations where the input data is highly variable or difficult to interpret due to noise. By adjusting the value of the alpha parameter, the user can control the degree of smoothing applied to the data, allowing them to tailor the indicator to their specific needs and preferences.
릴리즈 노트
bug fix릴리즈 노트
minor fix오픈 소스 스크립트
트레이딩뷰의 진정한 정신에 따라, 이 스크립트의 작성자는 이를 오픈소스로 공개하여 트레이더들이 기능을 검토하고 검증할 수 있도록 했습니다. 작성자에게 찬사를 보냅니다! 이 코드는 무료로 사용할 수 있지만, 코드를 재게시하는 경우 하우스 룰이 적용된다는 점을 기억하세요.
면책사항
해당 정보와 게시물은 금융, 투자, 트레이딩 또는 기타 유형의 조언이나 권장 사항으로 간주되지 않으며, 트레이딩뷰에서 제공하거나 보증하는 것이 아닙니다. 자세한 내용은 이용 약관을 참조하세요.
오픈 소스 스크립트
트레이딩뷰의 진정한 정신에 따라, 이 스크립트의 작성자는 이를 오픈소스로 공개하여 트레이더들이 기능을 검토하고 검증할 수 있도록 했습니다. 작성자에게 찬사를 보냅니다! 이 코드는 무료로 사용할 수 있지만, 코드를 재게시하는 경우 하우스 룰이 적용된다는 점을 기억하세요.
면책사항
해당 정보와 게시물은 금융, 투자, 트레이딩 또는 기타 유형의 조언이나 권장 사항으로 간주되지 않으며, 트레이딩뷰에서 제공하거나 보증하는 것이 아닙니다. 자세한 내용은 이용 약관을 참조하세요.