INVITE-ONLY SCRIPT
업데이트됨 CryptoAlgo DCA / Accumulation
This is a Dollar Cost Average (DCA) / Accumulation strategy. Every time there is a long signal it will buy a fixed USD amount that you have specified in the settings and keep buying at the dips and corrections in the market. This strategy is low-risk, however it assumes you have a long time horizon of at least 2+ years. The longer your holding-period, the better your returns.
There is 3 different entry conditions you can choose from:
The first entry condition is bollinger bands. Bollinger bands is a set of trendlines plotted two standard deviations (positively and negatively) away from a simple moving average (SMA) of an assets price. Every time a candle closes below the lower trendline the strategy will buy.
The second entry condition is the Relative Strength Index (RSI). The RSI is a momentum indicator used in technical analysis that measures the magnitude of recent price changes to evaluate overbought or oversold conditions in the price of a stock or other asset. Every time the RSI is meaning oversold and goes below a point of your choosing the strategy will buy.
The third entry condition is based on pivot points and moving averages that will determine small term trend changes in the market and low price points. Every time there is a bullish trend reversal the strategy will buy.
All three of these entry conditions can be controlled by a higher timeframe RSI that will stop entries when the RSI is above a certain point where the market is overbought and not ideal for accumulation.
The take profits in this strategy is dynamic and will signal trend changes like the third entry condition by using pivot points and moving averages. Since this is a DCA/ Accumulation strategy and will accumulate for the long term it will only exit a small percentage of the accumulated position. This will ensure that you take profit as the asset is appreciating in price while keeping the majority of the position for greater profit in the future.
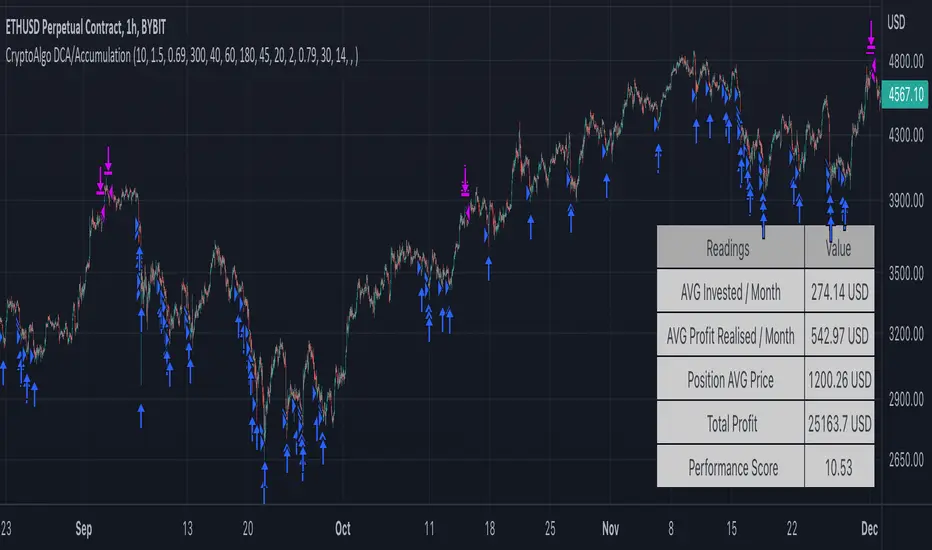
At the bottom right corner of the chart you will be able to see the key results of the DCA
The first reading is the Average amount USD that the strategy is investing on average every month. This value will help you identify the best settings for you and what USD amount the strategy should enter at the signals so that it stays below the amount you are willing to invest every month. Keep in mind that this is an average and that there will be a lot of deviation up or down based on where the market is going. If the market is having a correction the strategy will signal a lot more entries than when it is going up.
The second reading is the average profit per month. This is also an average and the result will go up exponentially from the starting point as the strategy accumulates and the market appreciates in price.
The third reading is the position average price. This is the average price all the accumulated USD in the asset.
The fourth reading is the total profit. This is the result of both the realised profit from taking profit and the accumulated usd amount left in the position.
The last reading is the performance score. This is a scoring system that i created that looks at the data from the readings and weighs it based on importance and then spits out a number that will help identify the best settings. The higher the number the better the performance, meaning more profit and better DCA.
When you have found the right settings you can insert the messages from your automatic trading platform at the bottom of the inputs and then create an alert with your unique webhook address along with the alert message below:
{{strategy.order.alert_message}}
You will be able to adjust all parameters in the settings.
Enjoy!
There is 3 different entry conditions you can choose from:
The first entry condition is bollinger bands. Bollinger bands is a set of trendlines plotted two standard deviations (positively and negatively) away from a simple moving average (SMA) of an assets price. Every time a candle closes below the lower trendline the strategy will buy.
The second entry condition is the Relative Strength Index (RSI). The RSI is a momentum indicator used in technical analysis that measures the magnitude of recent price changes to evaluate overbought or oversold conditions in the price of a stock or other asset. Every time the RSI is meaning oversold and goes below a point of your choosing the strategy will buy.
The third entry condition is based on pivot points and moving averages that will determine small term trend changes in the market and low price points. Every time there is a bullish trend reversal the strategy will buy.
All three of these entry conditions can be controlled by a higher timeframe RSI that will stop entries when the RSI is above a certain point where the market is overbought and not ideal for accumulation.
The take profits in this strategy is dynamic and will signal trend changes like the third entry condition by using pivot points and moving averages. Since this is a DCA/ Accumulation strategy and will accumulate for the long term it will only exit a small percentage of the accumulated position. This will ensure that you take profit as the asset is appreciating in price while keeping the majority of the position for greater profit in the future.
At the bottom right corner of the chart you will be able to see the key results of the DCA
The first reading is the Average amount USD that the strategy is investing on average every month. This value will help you identify the best settings for you and what USD amount the strategy should enter at the signals so that it stays below the amount you are willing to invest every month. Keep in mind that this is an average and that there will be a lot of deviation up or down based on where the market is going. If the market is having a correction the strategy will signal a lot more entries than when it is going up.
The second reading is the average profit per month. This is also an average and the result will go up exponentially from the starting point as the strategy accumulates and the market appreciates in price.
The third reading is the position average price. This is the average price all the accumulated USD in the asset.
The fourth reading is the total profit. This is the result of both the realised profit from taking profit and the accumulated usd amount left in the position.
The last reading is the performance score. This is a scoring system that i created that looks at the data from the readings and weighs it based on importance and then spits out a number that will help identify the best settings. The higher the number the better the performance, meaning more profit and better DCA.
When you have found the right settings you can insert the messages from your automatic trading platform at the bottom of the inputs and then create an alert with your unique webhook address along with the alert message below:
{{strategy.order.alert_message}}
You will be able to adjust all parameters in the settings.
Enjoy!
릴리즈 노트
Small change in the performance score calculation in the table초대 전용 스크립트
이 스크립트는 작성자가 승인한 사용자만 접근할 수 있습니다. 사용하려면 요청 후 승인을 받아야 하며, 일반적으로 결제 후에 허가가 부여됩니다. 자세한 내용은 아래 작성자의 안내를 따르거나 christofferka에게 직접 문의하세요.
트레이딩뷰는 스크립트의 작동 방식을 충분히 이해하고 작성자를 완전히 신뢰하지 않는 이상, 해당 스크립트에 비용을 지불하거나 사용하는 것을 권장하지 않습니다. 커뮤니티 스크립트에서 무료 오픈소스 대안을 찾아보실 수도 있습니다.
작성자 지시 사항
.
면책사항
해당 정보와 게시물은 금융, 투자, 트레이딩 또는 기타 유형의 조언이나 권장 사항으로 간주되지 않으며, 트레이딩뷰에서 제공하거나 보증하는 것이 아닙니다. 자세한 내용은 이용 약관을 참조하세요.
초대 전용 스크립트
이 스크립트는 작성자가 승인한 사용자만 접근할 수 있습니다. 사용하려면 요청 후 승인을 받아야 하며, 일반적으로 결제 후에 허가가 부여됩니다. 자세한 내용은 아래 작성자의 안내를 따르거나 christofferka에게 직접 문의하세요.
트레이딩뷰는 스크립트의 작동 방식을 충분히 이해하고 작성자를 완전히 신뢰하지 않는 이상, 해당 스크립트에 비용을 지불하거나 사용하는 것을 권장하지 않습니다. 커뮤니티 스크립트에서 무료 오픈소스 대안을 찾아보실 수도 있습니다.
작성자 지시 사항
.
면책사항
해당 정보와 게시물은 금융, 투자, 트레이딩 또는 기타 유형의 조언이나 권장 사항으로 간주되지 않으며, 트레이딩뷰에서 제공하거나 보증하는 것이 아닙니다. 자세한 내용은 이용 약관을 참조하세요.