OPEN-SOURCE SCRIPT
업데이트됨 Daily Bubble Risk Adjustment

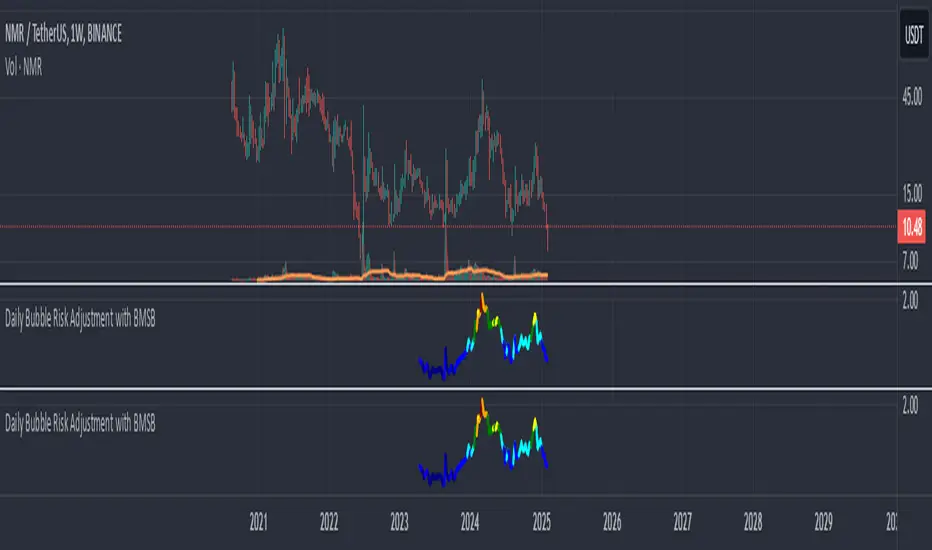
This script calculates the ratio of the asset's closing price to its 20-week moving average (20W MA) and visualizes it as a color-coded line chart. The script also includes a customizable moving average (default: 111-day MA) to help smooth the ratio trend.
It identifies overbought and oversold conditions relative to the 20W MA, making it a valuable tool for long-term trend analysis.
It identifies overbought and oversold conditions relative to the 20W MA, making it a valuable tool for long-term trend analysis.
릴리즈 노트
This script calculates the ratio of the asset's closing price to its 20-week moving average (20W MA) and visualizes it as a color-coded line chart. The script also includes a customizable moving average (default: 111-day MA) to help smooth the ratio trend.It identifies overbought and oversold conditions relative to the 20W MA, making it a valuable tool for long-term trend analysis.
릴리즈 노트
Key Updates:BMSB Implementation:
Added 20-SMA and 21-EMA calculations based on the ratio instead of price.
Introduced a shaded area between the two for better visualization.
Revised Color Assignments:
Adjusted the color gradient for different ratio ranges.
Improved color contrast for better readability.
Divergence Detection:
Implemented regular bullish and bearish divergences using pivot points.
Added labels and markers for easier trend identification.
릴리즈 노트
some adjustments for colors오픈 소스 스크립트
트레이딩뷰의 진정한 정신에 따라, 이 스크립트의 작성자는 이를 오픈소스로 공개하여 트레이더들이 기능을 검토하고 검증할 수 있도록 했습니다. 작성자에게 찬사를 보냅니다! 이 코드는 무료로 사용할 수 있지만, 코드를 재게시하는 경우 하우스 룰이 적용된다는 점을 기억하세요.
면책사항
해당 정보와 게시물은 금융, 투자, 트레이딩 또는 기타 유형의 조언이나 권장 사항으로 간주되지 않으며, 트레이딩뷰에서 제공하거나 보증하는 것이 아닙니다. 자세한 내용은 이용 약관을 참조하세요.
오픈 소스 스크립트
트레이딩뷰의 진정한 정신에 따라, 이 스크립트의 작성자는 이를 오픈소스로 공개하여 트레이더들이 기능을 검토하고 검증할 수 있도록 했습니다. 작성자에게 찬사를 보냅니다! 이 코드는 무료로 사용할 수 있지만, 코드를 재게시하는 경우 하우스 룰이 적용된다는 점을 기억하세요.
면책사항
해당 정보와 게시물은 금융, 투자, 트레이딩 또는 기타 유형의 조언이나 권장 사항으로 간주되지 않으며, 트레이딩뷰에서 제공하거나 보증하는 것이 아닙니다. 자세한 내용은 이용 약관을 참조하세요.