OPEN-SOURCE SCRIPT
Harmonic Moving Average Confluence with Cross Signals
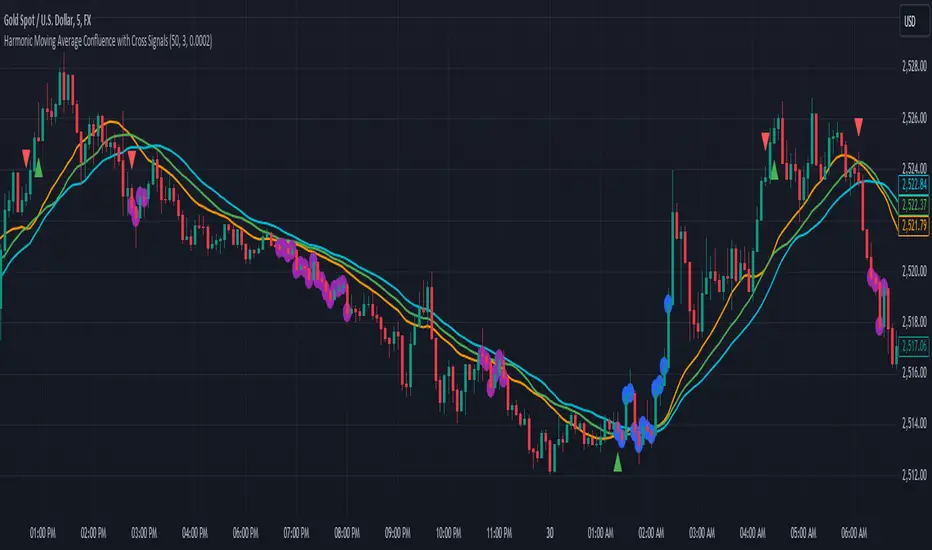
Harmonic Moving Average Confluence with Cross Signals
Overview:
The "Harmonic Moving Average Confluence with Cross Signals" is a custom indicator designed to analyze harmonic moving averages and identify confluence zones on a chart. It provides insights into potential trading opportunities through cross signals and confluence detection.
Features:
Harmonic Moving Averages (HMAs):
38.2% HMA
50% HMA
61.8% HMA
These HMAs are calculated based on a base period and plotted on the chart to identify key support and resistance levels.
Cross Detection:
Buy Signal: Triggered when the 38.2% HMA crosses above the 50% HMA.
Sell Signal: Triggered when the 38.2% HMA crosses below the 50% HMA.
Buy signals are marked with green triangles below the candles.
Sell signals are marked with red triangles above the candles.
Confluence Detection:
Confluence zones are identified where two or more HMAs are within a specified percentage difference from each other.
Confluence Strength: Default minimum strength is set to 3.
Threshold Percentage: Default is set to 0.0002%.
Confluence zones are marked with blue circles on the chart, with 80% opacity.
Default Settings:
Base Period: 50
Minimum Confluence Strength: 3
Confluence Threshold: 0.0002%
Confluence Circles Opacity: 80%
How to Use It:
Setup:
Add the indicator to your trading chart.
The indicator will automatically calculate and plot the harmonic moving averages and detect cross signals and confluence zones based on the default settings.
Interpreting Signals:
Buy Signal: Look for green triangles below the candles indicating a potential buying opportunity when the 38.2% HMA crosses above the 50% HMA.
Sell Signal: Look for red triangles above the candles indicating a potential selling opportunity when the 38.2% HMA crosses below the 50% HMA.
Confluence Zones: Blue circles represent areas where two or more HMAs are within the specified threshold percentage, indicating potential trading zones.
Adjusting Parameters:
Base Period: Adjust to change the period of the moving averages if needed.
Minimum Confluence Strength: Set to control how many confluence zones need to be present to display a circle.
Threshold Percentage: Set to adjust the sensitivity of confluence detection.
Usage Tips:
Use the signals in conjunction with other technical analysis tools to enhance your trading strategy.
Monitor confluence zones for possible high-interest trading opportunities.
I hope this version aligns better with your needs. If there's anything specific you'd like to adjust or add, just let me know!
오픈 소스 스크립트
트레이딩뷰의 진정한 정신에 따라, 이 스크립트의 작성자는 이를 오픈소스로 공개하여 트레이더들이 기능을 검토하고 검증할 수 있도록 했습니다. 작성자에게 찬사를 보냅니다! 이 코드는 무료로 사용할 수 있지만, 코드를 재게시하는 경우 하우스 룰이 적용된다는 점을 기억하세요.
면책사항
해당 정보와 게시물은 금융, 투자, 트레이딩 또는 기타 유형의 조언이나 권장 사항으로 간주되지 않으며, 트레이딩뷰에서 제공하거나 보증하는 것이 아닙니다. 자세한 내용은 이용 약관을 참조하세요.
오픈 소스 스크립트
트레이딩뷰의 진정한 정신에 따라, 이 스크립트의 작성자는 이를 오픈소스로 공개하여 트레이더들이 기능을 검토하고 검증할 수 있도록 했습니다. 작성자에게 찬사를 보냅니다! 이 코드는 무료로 사용할 수 있지만, 코드를 재게시하는 경우 하우스 룰이 적용된다는 점을 기억하세요.
면책사항
해당 정보와 게시물은 금융, 투자, 트레이딩 또는 기타 유형의 조언이나 권장 사항으로 간주되지 않으며, 트레이딩뷰에서 제공하거나 보증하는 것이 아닙니다. 자세한 내용은 이용 약관을 참조하세요.