OPEN-SOURCE SCRIPT
Dual Strength RSI
Dual Strength RSI Indicator
Republished: The original script violated house rules by including an external link to Backtest Rookies.
Background
This is a simple indicator was designed as part of a tutorial on the Backtest-Rookies website.
Logic
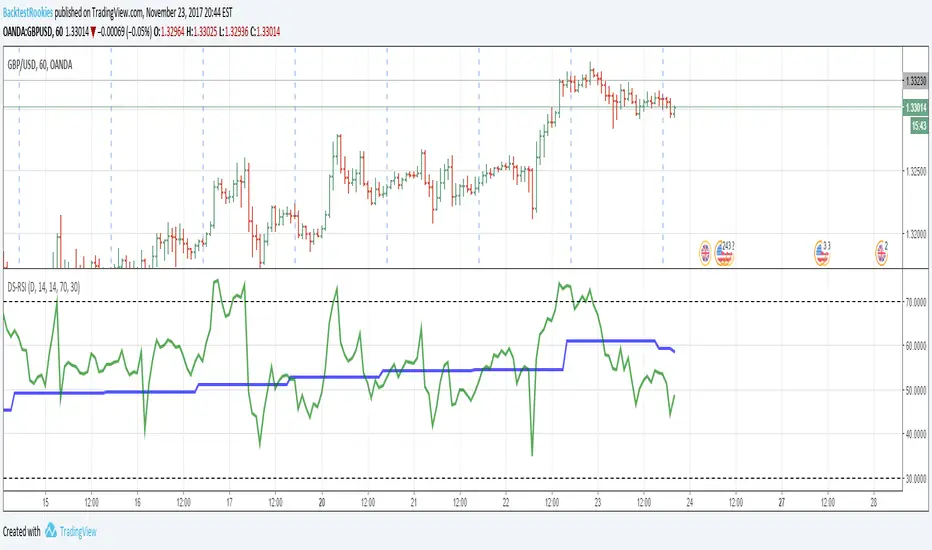
The indicator will plot RSI values from 2 timeframes. The first plotted line will be the current timeframe and the second line will be a user selected timeframe. The theory is that if the instrument is overbought / oversold on two timeframes at the same time, it might be more likely to reverse or revert to the mean.
As with most oscillating indicators, this will likely be most suitable for ranging market conditions.
Examples


Republished: The original script violated house rules by including an external link to Backtest Rookies.
Background
This is a simple indicator was designed as part of a tutorial on the Backtest-Rookies website.
Logic
The indicator will plot RSI values from 2 timeframes. The first plotted line will be the current timeframe and the second line will be a user selected timeframe. The theory is that if the instrument is overbought / oversold on two timeframes at the same time, it might be more likely to reverse or revert to the mean.
As with most oscillating indicators, this will likely be most suitable for ranging market conditions.
Examples
오픈 소스 스크립트
트레이딩뷰의 진정한 정신에 따라, 이 스크립트의 작성자는 이를 오픈소스로 공개하여 트레이더들이 기능을 검토하고 검증할 수 있도록 했습니다. 작성자에게 찬사를 보냅니다! 이 코드는 무료로 사용할 수 있지만, 코드를 재게시하는 경우 하우스 룰이 적용된다는 점을 기억하세요.
면책사항
해당 정보와 게시물은 금융, 투자, 트레이딩 또는 기타 유형의 조언이나 권장 사항으로 간주되지 않으며, 트레이딩뷰에서 제공하거나 보증하는 것이 아닙니다. 자세한 내용은 이용 약관을 참조하세요.
오픈 소스 스크립트
트레이딩뷰의 진정한 정신에 따라, 이 스크립트의 작성자는 이를 오픈소스로 공개하여 트레이더들이 기능을 검토하고 검증할 수 있도록 했습니다. 작성자에게 찬사를 보냅니다! 이 코드는 무료로 사용할 수 있지만, 코드를 재게시하는 경우 하우스 룰이 적용된다는 점을 기억하세요.
면책사항
해당 정보와 게시물은 금융, 투자, 트레이딩 또는 기타 유형의 조언이나 권장 사항으로 간주되지 않으며, 트레이딩뷰에서 제공하거나 보증하는 것이 아닙니다. 자세한 내용은 이용 약관을 참조하세요.