PROTECTED SOURCE SCRIPT
업데이트됨 Index Volume
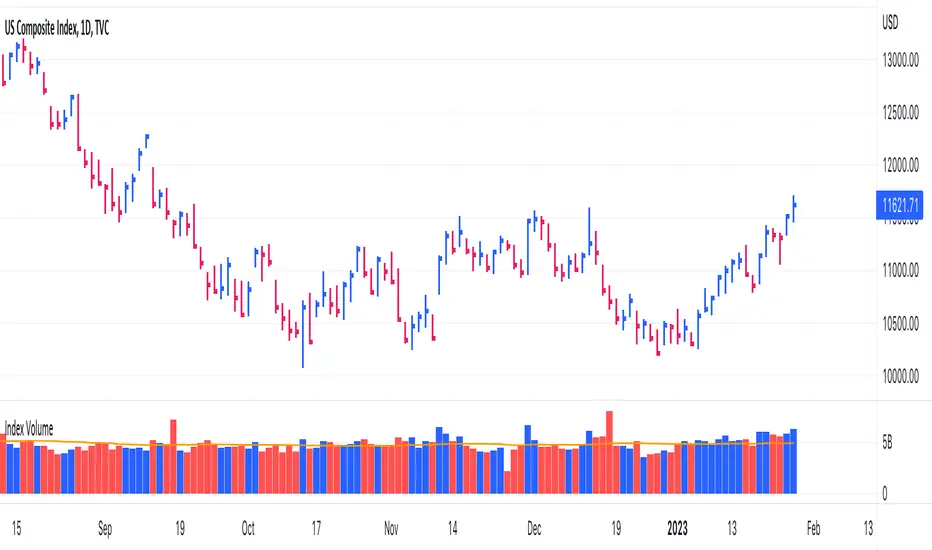
This indicator displays the volume for the Nasdaq Composite and S&P500 indexes just like any other stock. Also displays any normal stock volume as well. Customizations include choice of colors and moving average length.
릴리즈 노트
New option to automatically plot a diamond on follow through and distribution days. Also have the ability to show distribution clusters. (4 distribution days in a rolling 8 day window) 릴리즈 노트
Cleaned up the status line display to only show Volume and Volume Average릴리즈 노트
Added ability for volatility adjusted follow through days, as defined in IBD's Market School. - Volatility defined as the average percentage gain of the up days over the prior 200 days.
- Volatility less than or equal to 0.4%, follow-through must close up 0.7% or higher.
- Volatility greater than or equal to 0.4% and less than 0.55%, follow-through must close up 0.85% or higher.
- Volatility greater than or equal to 0.55% and less than 1.00%, follow-through must close up 1.00% or higher.
- Volatility greater than or equal to 1.00%, follow-through must close up 1.245% or higher.
릴리즈 노트
Updated volume source for the indexes, should update in real time now. 릴리즈 노트
Update shows volume run rate on stocks. 보호된 스크립트입니다
이 스크립트는 비공개 소스로 게시됩니다. 하지만 이를 자유롭게 제한 없이 사용할 수 있습니다 – 자세한 내용은 여기에서 확인하세요.
Trusted Pine programmer. Send me a message for script development.
면책사항
해당 정보와 게시물은 금융, 투자, 트레이딩 또는 기타 유형의 조언이나 권장 사항으로 간주되지 않으며, 트레이딩뷰에서 제공하거나 보증하는 것이 아닙니다. 자세한 내용은 이용 약관을 참조하세요.
보호된 스크립트입니다
이 스크립트는 비공개 소스로 게시됩니다. 하지만 이를 자유롭게 제한 없이 사용할 수 있습니다 – 자세한 내용은 여기에서 확인하세요.
Trusted Pine programmer. Send me a message for script development.
면책사항
해당 정보와 게시물은 금융, 투자, 트레이딩 또는 기타 유형의 조언이나 권장 사항으로 간주되지 않으며, 트레이딩뷰에서 제공하거나 보증하는 것이 아닙니다. 자세한 내용은 이용 약관을 참조하세요.