PROTECTED SOURCE SCRIPT
EarlBMACD
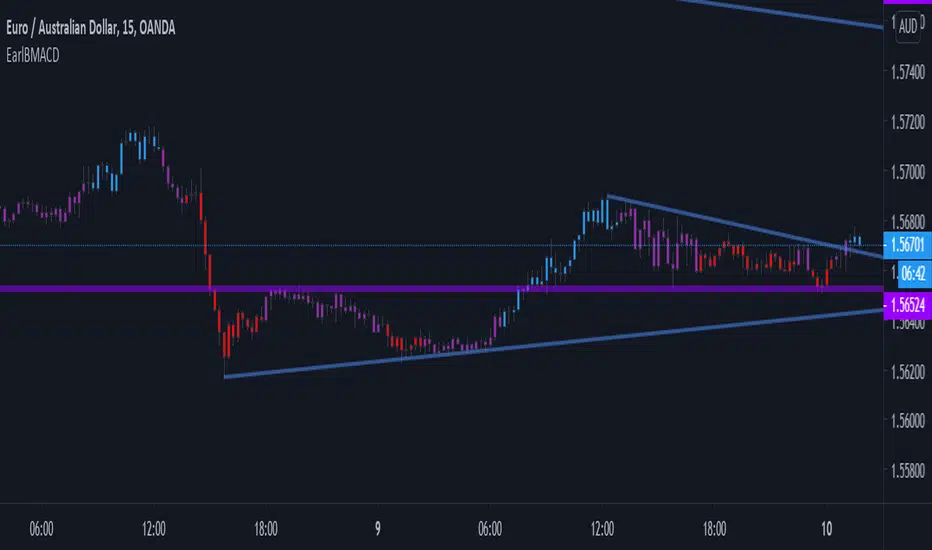
This indicator looks for a crossover of the MACD moving averages (12ema and 26ema) to generate a buy/sell signal and a crossover
of the MACD line (12ema minus 26ema) and MACD signal line (9ema of MACD line) in order to generate a completely seperate buy/sell signal.
The two buy/sell signals are combined into a hybrid buy/sell/hold indicator which looks for one, neither, or both to be "buys."
If both signals are buys (fast crossed above slow), a "buy" signal is given (green bar color)
If only one signal is a buy, a "hold" signal is given (yellow bar color)
If neither signal is a buy, a "sell" signal is given (red bar color) Note: MACD moving averages crossing over is the same thing as the MACD line crossing the zero level in the MACD indicator
It makes sense to have the MACD indicator loaded as a reference when using this but it isn't required.
The lines plotted on the chart are the 12ema and a signal line which is the MACD signal line shown relative to the 12ema rather than the MACD line
The 26ema is not plotted on the chart because the chart becomes cluttered,
plus the moving averages crossover is indicated with the MACD indicator.
보호된 스크립트입니다
이 스크립트는 비공개 소스로 게시됩니다. 하지만 이를 자유롭게 제한 없이 사용할 수 있습니다 – 자세한 내용은 여기에서 확인하세요.
면책사항
해당 정보와 게시물은 금융, 투자, 트레이딩 또는 기타 유형의 조언이나 권장 사항으로 간주되지 않으며, 트레이딩뷰에서 제공하거나 보증하는 것이 아닙니다. 자세한 내용은 이용 약관을 참조하세요.
보호된 스크립트입니다
이 스크립트는 비공개 소스로 게시됩니다. 하지만 이를 자유롭게 제한 없이 사용할 수 있습니다 – 자세한 내용은 여기에서 확인하세요.
면책사항
해당 정보와 게시물은 금융, 투자, 트레이딩 또는 기타 유형의 조언이나 권장 사항으로 간주되지 않으며, 트레이딩뷰에서 제공하거나 보증하는 것이 아닙니다. 자세한 내용은 이용 약관을 참조하세요.