OPEN-SOURCE SCRIPT
Date Marker GPT
Date Marker GPT
By Jimmy Dimos (corrected by ChatGPT-o3)
Description
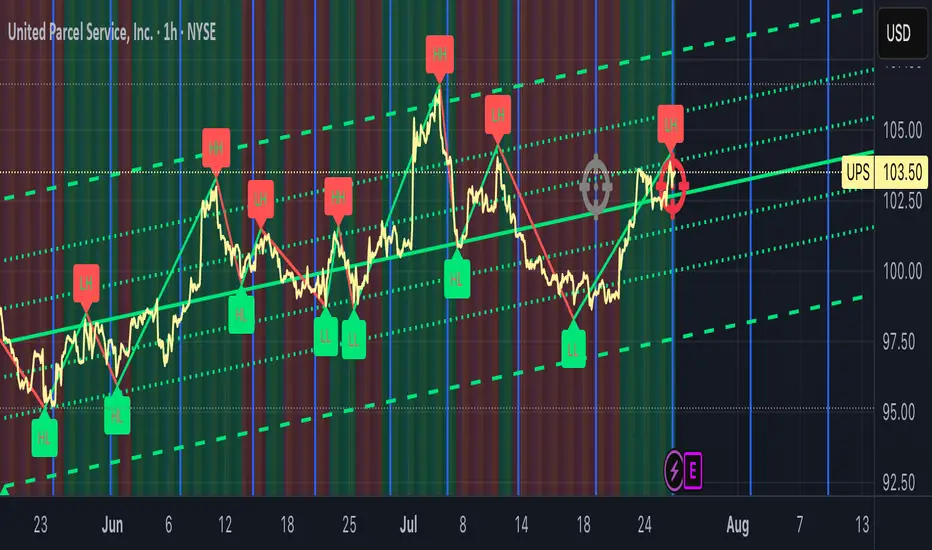
This overlay indicator automatically plots vertical lines at each weekly option-expiration timestamp (Friday at 3 PM CST) for both historical and upcoming periods, helping you visualize key expiration dates alongside your price action and regression tools. Shown is my Date Maker GPT vertical blue Lines, Linear Regression Channel(not part of my script) and zigzag++[LD] also not part of my script.
⸻
Key Features
• Past Expirations: Draws 12 past Friday markers at 3 PM CST
• Future Expirations: Projects 12 upcoming Friday markers at 3 PM CST
• Timezone Handling: Uses UTC internally (21:00 UTC = 3 PM CST)
• Customizable: num_fridays_past and num_fridays_future inputs let you adjust how many weeks to display
⸻
How It Works
1. Timestamp Calculation
• Uses Pine Script’s dayofweek() and timestamp() functions to find each Friday at the target hour.
• Two helper functions, get_previous_friday() and get_next_friday(), compute offsets in days/weeks based on the current bar’s date.
2. Drawing Lines
• Loops through the specified number of weeks in the past and future.
• Calls line.new() for each expiration timestamp, extending lines across the entire chart.
⸻
Usage Tips
• Overlay this script on any OHLC chart to see how price tends to cluster around option expirations.
• Combine with a linear regression or trend-channel indicator to anticipate likely trading ranges leading into expiration.
• Tweak the num_fridays_past and num_fridays_future parameters to focus on shorter or longer horizons.
⸻
Disclaimer: This tool is provided for educational and analytical purposes only. It is not financial advice. Always conduct your own research and risk management.
By Jimmy Dimos (corrected by ChatGPT-o3)
Description
This overlay indicator automatically plots vertical lines at each weekly option-expiration timestamp (Friday at 3 PM CST) for both historical and upcoming periods, helping you visualize key expiration dates alongside your price action and regression tools. Shown is my Date Maker GPT vertical blue Lines, Linear Regression Channel(not part of my script) and zigzag++[LD] also not part of my script.
⸻
Key Features
• Past Expirations: Draws 12 past Friday markers at 3 PM CST
• Future Expirations: Projects 12 upcoming Friday markers at 3 PM CST
• Timezone Handling: Uses UTC internally (21:00 UTC = 3 PM CST)
• Customizable: num_fridays_past and num_fridays_future inputs let you adjust how many weeks to display
⸻
How It Works
1. Timestamp Calculation
• Uses Pine Script’s dayofweek() and timestamp() functions to find each Friday at the target hour.
• Two helper functions, get_previous_friday() and get_next_friday(), compute offsets in days/weeks based on the current bar’s date.
2. Drawing Lines
• Loops through the specified number of weeks in the past and future.
• Calls line.new() for each expiration timestamp, extending lines across the entire chart.
⸻
Usage Tips
• Overlay this script on any OHLC chart to see how price tends to cluster around option expirations.
• Combine with a linear regression or trend-channel indicator to anticipate likely trading ranges leading into expiration.
• Tweak the num_fridays_past and num_fridays_future parameters to focus on shorter or longer horizons.
⸻
Disclaimer: This tool is provided for educational and analytical purposes only. It is not financial advice. Always conduct your own research and risk management.
오픈 소스 스크립트
트레이딩뷰의 진정한 정신에 따라, 이 스크립트의 작성자는 이를 오픈소스로 공개하여 트레이더들이 기능을 검토하고 검증할 수 있도록 했습니다. 작성자에게 찬사를 보냅니다! 이 코드는 무료로 사용할 수 있지만, 코드를 재게시하는 경우 하우스 룰이 적용된다는 점을 기억하세요.
면책사항
해당 정보와 게시물은 금융, 투자, 트레이딩 또는 기타 유형의 조언이나 권장 사항으로 간주되지 않으며, 트레이딩뷰에서 제공하거나 보증하는 것이 아닙니다. 자세한 내용은 이용 약관을 참조하세요.
오픈 소스 스크립트
트레이딩뷰의 진정한 정신에 따라, 이 스크립트의 작성자는 이를 오픈소스로 공개하여 트레이더들이 기능을 검토하고 검증할 수 있도록 했습니다. 작성자에게 찬사를 보냅니다! 이 코드는 무료로 사용할 수 있지만, 코드를 재게시하는 경우 하우스 룰이 적용된다는 점을 기억하세요.
면책사항
해당 정보와 게시물은 금융, 투자, 트레이딩 또는 기타 유형의 조언이나 권장 사항으로 간주되지 않으며, 트레이딩뷰에서 제공하거나 보증하는 것이 아닙니다. 자세한 내용은 이용 약관을 참조하세요.