PROTECTED SOURCE SCRIPT
업데이트됨 Correlation of Price Spread and Volume
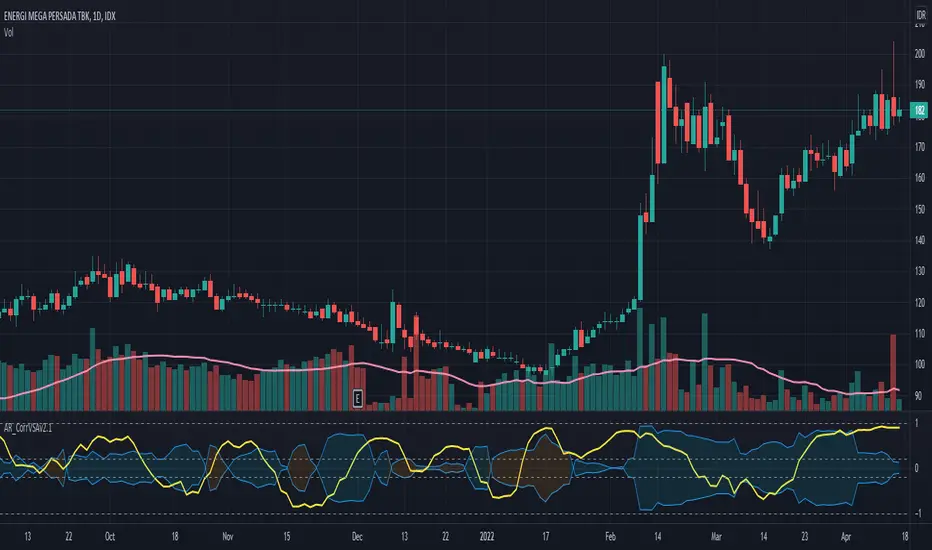
Correlation between candle's price spread (length of candle of each bar) and volume.
Generally, increases in volume precede significant price movements. However, If the price is rising in an uptrend but the volume is reducing, it may show that there’s little interest in the instrument, and the price may reverse.
The closer the correlation is to 1.0, indicates the instruments will move up and down together as it is expected with volume and price spread. So the correlation Indicator aims to display when the price spread and volume is in correlation and not. Blue color represent positive correlation while orange negative correlation. The strength of the correlation is determined by the width of the bands.
릴리즈 노트
Added horizontal lines to indicate the strength of the correlation (default 0.2).릴리즈 노트
Updated the title릴리즈 노트
Fix the algorithm릴리즈 노트
Added yellow line for the correlation with the user-selected instrument.릴리즈 노트
Changed the default length parameter보호된 스크립트입니다
이 스크립트는 비공개 소스로 게시됩니다. 하지만 이를 자유롭게 제한 없이 사용할 수 있습니다 – 자세한 내용은 여기에서 확인하세요.
면책사항
해당 정보와 게시물은 금융, 투자, 트레이딩 또는 기타 유형의 조언이나 권장 사항으로 간주되지 않으며, 트레이딩뷰에서 제공하거나 보증하는 것이 아닙니다. 자세한 내용은 이용 약관을 참조하세요.
보호된 스크립트입니다
이 스크립트는 비공개 소스로 게시됩니다. 하지만 이를 자유롭게 제한 없이 사용할 수 있습니다 – 자세한 내용은 여기에서 확인하세요.
면책사항
해당 정보와 게시물은 금융, 투자, 트레이딩 또는 기타 유형의 조언이나 권장 사항으로 간주되지 않으며, 트레이딩뷰에서 제공하거나 보증하는 것이 아닙니다. 자세한 내용은 이용 약관을 참조하세요.