OPEN-SOURCE SCRIPT
DZ SR Buy&Sell Enhanced Strategy
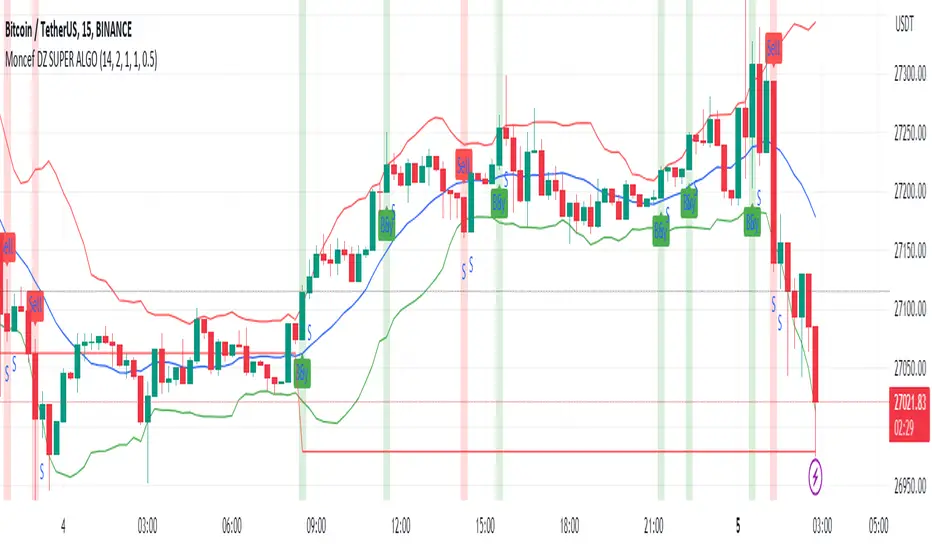
This ALGERIAN indicator titled "SR Buy&Sell with Enhanced Strategy" is designed to identify support and resistance levels on a financial chart, and generates enhanced buy and sell signals based on these levels. It is based on a trading strategy that uses a combination of moving means and standard deviation to calculate support and resistance levels.
The indicator plots support and resistance levels on the chart, with blue color for base level, red for resistance and green for support. Green arrows are displayed when a buy signal is generated, and red arrows when a sell signal is generated.
The market entry strategy is based on breaking support and resistance levels. When a buy signal is generated and no position is opened, a buy position is opened with a take profit and stop loss level calculated according to the parameters set by the user. Similarly, when a sell signal is generated and no position is opened, a sell position is opened with the corresponding take profit and stop loss levels.
The indicator also displays a “STOP” indicator when a position exit signal is generated, indicating to the trader that it is time to close the current position.
This indicator is a powerful tool for traders who want to exploit support and resistance levels to improve their trading decisions. It can be used in different financial markets and different time periods. Parameters such as average moving length, deviations and multiplier can be adjusted according to individual trader preferences.
Note: This indicator only provides potential signals and does not guarantee positive results with every trade. It is recommended to use this indicator in combination with other technical analysis and risk management tools to make informed decisions when trading.
오픈 소스 스크립트
트레이딩뷰의 진정한 정신에 따라, 이 스크립트의 작성자는 이를 오픈소스로 공개하여 트레이더들이 기능을 검토하고 검증할 수 있도록 했습니다. 작성자에게 찬사를 보냅니다! 이 코드는 무료로 사용할 수 있지만, 코드를 재게시하는 경우 하우스 룰이 적용된다는 점을 기억하세요.
면책사항
해당 정보와 게시물은 금융, 투자, 트레이딩 또는 기타 유형의 조언이나 권장 사항으로 간주되지 않으며, 트레이딩뷰에서 제공하거나 보증하는 것이 아닙니다. 자세한 내용은 이용 약관을 참조하세요.
오픈 소스 스크립트
트레이딩뷰의 진정한 정신에 따라, 이 스크립트의 작성자는 이를 오픈소스로 공개하여 트레이더들이 기능을 검토하고 검증할 수 있도록 했습니다. 작성자에게 찬사를 보냅니다! 이 코드는 무료로 사용할 수 있지만, 코드를 재게시하는 경우 하우스 룰이 적용된다는 점을 기억하세요.
면책사항
해당 정보와 게시물은 금융, 투자, 트레이딩 또는 기타 유형의 조언이나 권장 사항으로 간주되지 않으며, 트레이딩뷰에서 제공하거나 보증하는 것이 아닙니다. 자세한 내용은 이용 약관을 참조하세요.