OPEN-SOURCE SCRIPT
업데이트됨 Auto-Support v 0.2
Same script as the previous version with a slight twist
Have added (lines) "Transparency" to the settings to avoid having to edit every line individually ...
Cheers
Have added (lines) "Transparency" to the settings to avoid having to edit every line individually ...
Cheers
릴리즈 노트
*** Bug Fix version after today's error message issues ****Anyone using previous versions is strongly advised to update
> Removed some higher s/r levels from the code
> Sensitivity can now only be set between 1 - 10, higher numbers cause the script to fail to load
***********************************************************************
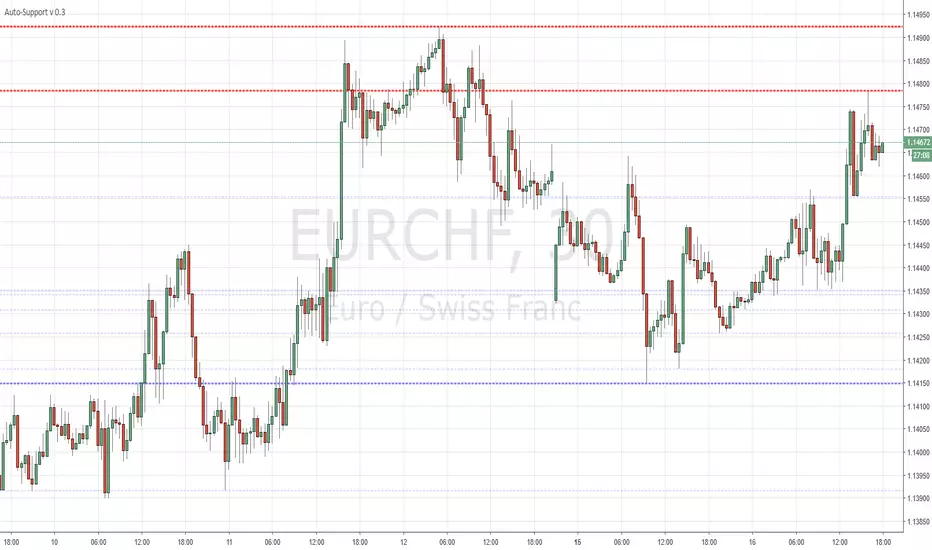
Fairly simple script that automatically draws highs and lows for the past X periods at various intervals.
3 Settings :
"Sensitivity" which amounts to the horizontal separation from one high to the next high (default multiplicator : 10)
"Transparency" ... Multiple lines piling up at the same level will cause the s/r levels to be more or less visible.
Variable "b" which is the HEX color for resistances (default : red)
Variable "c" which is the HEX color for supports (default : blue)
More HEX color codes on hexcolortool.com/ (not my webpage :)
Feel free to edit the script to your taste.
오픈 소스 스크립트
트레이딩뷰의 진정한 정신에 따라, 이 스크립트의 작성자는 이를 오픈소스로 공개하여 트레이더들이 기능을 검토하고 검증할 수 있도록 했습니다. 작성자에게 찬사를 보냅니다! 이 코드는 무료로 사용할 수 있지만, 코드를 재게시하는 경우 하우스 룰이 적용된다는 점을 기억하세요.
면책사항
해당 정보와 게시물은 금융, 투자, 트레이딩 또는 기타 유형의 조언이나 권장 사항으로 간주되지 않으며, 트레이딩뷰에서 제공하거나 보증하는 것이 아닙니다. 자세한 내용은 이용 약관을 참조하세요.
오픈 소스 스크립트
트레이딩뷰의 진정한 정신에 따라, 이 스크립트의 작성자는 이를 오픈소스로 공개하여 트레이더들이 기능을 검토하고 검증할 수 있도록 했습니다. 작성자에게 찬사를 보냅니다! 이 코드는 무료로 사용할 수 있지만, 코드를 재게시하는 경우 하우스 룰이 적용된다는 점을 기억하세요.
면책사항
해당 정보와 게시물은 금융, 투자, 트레이딩 또는 기타 유형의 조언이나 권장 사항으로 간주되지 않으며, 트레이딩뷰에서 제공하거나 보증하는 것이 아닙니다. 자세한 내용은 이용 약관을 참조하세요.