OPEN-SOURCE SCRIPT
Levels[cz]

Description
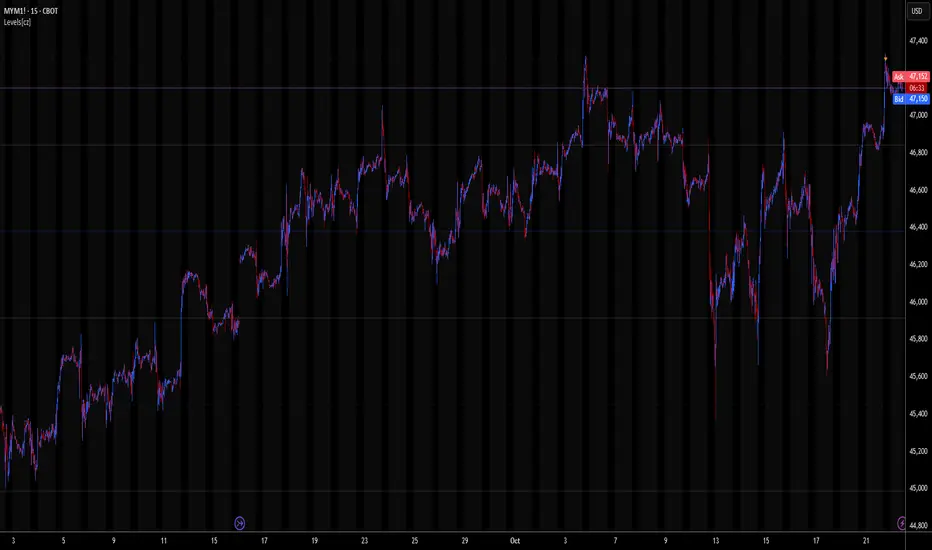
Levels[cz] is a proportional price grid indicator that draws adaptive horizontal levels based on higher timeframe (HTF) closes.
Instead of relying on swing highs/lows or pivots, it builds structured support and resistance zones using fixed percentage increments from a Daily, Weekly, or Monthly reference close.
This creates a consistent geometric framework that helps traders visualize price zones where reactions or consolidations often occur.
How It Works
Visibility is dynamically controlled by timeframe:
This ensures the right amount of structural detail at every zoom level.
How to Use
Concept
The indicator is based on the idea that markets move in proportional price steps, not random fluctuations.
By anchoring levels to a higher-timeframe close and expanding outward geometrically, Levels[cz] highlights recurring equilibrium and expansion zones — areas where traders can anticipate probable turning points or consolidations.
Features
Fully customizable colors, styles, and widths
Levels[cz] is a proportional price grid indicator that draws adaptive horizontal levels based on higher timeframe (HTF) closes.
Instead of relying on swing highs/lows or pivots, it builds structured support and resistance zones using fixed percentage increments from a Daily, Weekly, or Monthly reference close.
This creates a consistent geometric framework that helps traders visualize price zones where reactions or consolidations often occur.
How It Works
- The script retrieves the last HTF close (Daily/Weekly/Monthly).
- It then calculates percentage-based increments (e.g., 0.5%, 1%, 2%, 4%) above and below that reference.
- Each percentage forms a distinct “level group,” creating layered grids of potential reaction zones.
- Levels are automatically filtered to avoid overlap between different groups, keeping the chart clean.
Visibility is dynamically controlled by timeframe:
- Level 1 → up to 15m
- Level 2 → up to 1h
- Level 3 → up to 4h
- Level 4 → up to 1D
This ensures the right amount of structural detail at every zoom level.
How to Use
- Identify confluence zones where multiple levels cluster — often areas of strong liquidity or reversals.
- Use the grid as a support/resistance map for entries, targets, and stop placement.
- Combine with trend or momentum indicators to validate reactions at key price bands.
- Adjust the percentage increments and reference timeframe to match the volatility of your instrument (e.g., smaller steps for crypto, larger for indices).
Concept
The indicator is based on the idea that markets move in proportional price steps, not random fluctuations.
By anchoring levels to a higher-timeframe close and expanding outward geometrically, Levels[cz] highlights recurring equilibrium and expansion zones — areas where traders can anticipate probable turning points or consolidations.
Features
- 4 customizable percentage-based level sets
- Dynamic visibility by timeframe
- Non-overlapping level hierarchy
- Lightweight on performance
Fully customizable colors, styles, and widths
오픈 소스 스크립트
트레이딩뷰의 진정한 정신에 따라, 이 스크립트의 작성자는 이를 오픈소스로 공개하여 트레이더들이 기능을 검토하고 검증할 수 있도록 했습니다. 작성자에게 찬사를 보냅니다! 이 코드는 무료로 사용할 수 있지만, 코드를 재게시하는 경우 하우스 룰이 적용된다는 점을 기억하세요.
면책사항
해당 정보와 게시물은 금융, 투자, 트레이딩 또는 기타 유형의 조언이나 권장 사항으로 간주되지 않으며, 트레이딩뷰에서 제공하거나 보증하는 것이 아닙니다. 자세한 내용은 이용 약관을 참조하세요.
오픈 소스 스크립트
트레이딩뷰의 진정한 정신에 따라, 이 스크립트의 작성자는 이를 오픈소스로 공개하여 트레이더들이 기능을 검토하고 검증할 수 있도록 했습니다. 작성자에게 찬사를 보냅니다! 이 코드는 무료로 사용할 수 있지만, 코드를 재게시하는 경우 하우스 룰이 적용된다는 점을 기억하세요.
면책사항
해당 정보와 게시물은 금융, 투자, 트레이딩 또는 기타 유형의 조언이나 권장 사항으로 간주되지 않으며, 트레이딩뷰에서 제공하거나 보증하는 것이 아닙니다. 자세한 내용은 이용 약관을 참조하세요.