PROTECTED SOURCE SCRIPT
업데이트됨 Bog™ Cycle Detector
The Cycle Detector is a tool that can be used to dial in the Bog if you are having difficulty. Think of it like training wheels. You can measure the average cycle length and average the Bog in according to the formula explained below. You want to set the Bog length to half the average length of the Cycle Detector and the channel length to 1/4 of the average length of the Cycle Detector.
THIS INDICATOR DOES NOT GIVE BUY OR SELL SIGNALS. THIS INDICATOR IS ONLY USED TO DIAL IN THE SETTINGS OF THE BOG ONLY
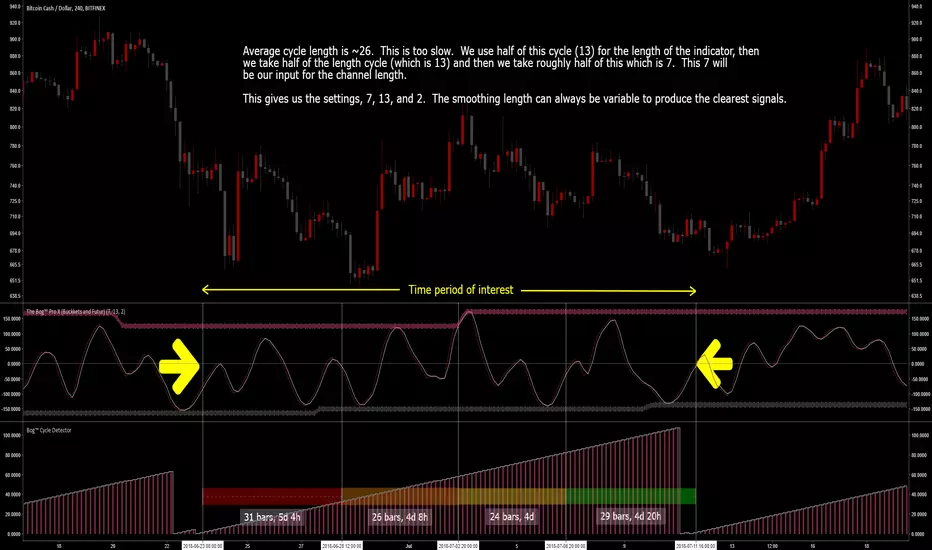
Example for the chart above:
Average cycle length is ~26. This is too slow. We use half of this cycle (13) for the length of the indicator, then we take half of the length cycle (which is 13) and then we take roughly half of this which is 7. This 7 will be our input for the channel length.
This gives us the settings, 7, 13, and 2. The smoothing length can always be variable to produce the clearest signals.
Dealing with Chop:
On occasion, when trends are changing, you may find micro bumps or trends. You can either divide these or combine them into the larger trend. In the chart below, there are two possible ways to process the data. Either two smaller triangles could be considered, or one larger triangle could be generated. With time you with have a good idea of how to best interpret these residual signals.

THIS INDICATOR DOES NOT GIVE BUY OR SELL SIGNALS. THIS INDICATOR IS ONLY USED TO DIAL IN THE SETTINGS OF THE BOG ONLY
Example for the chart above:
Average cycle length is ~26. This is too slow. We use half of this cycle (13) for the length of the indicator, then we take half of the length cycle (which is 13) and then we take roughly half of this which is 7. This 7 will be our input for the channel length.
This gives us the settings, 7, 13, and 2. The smoothing length can always be variable to produce the clearest signals.
Dealing with Chop:
On occasion, when trends are changing, you may find micro bumps or trends. You can either divide these or combine them into the larger trend. In the chart below, there are two possible ways to process the data. Either two smaller triangles could be considered, or one larger triangle could be generated. With time you with have a good idea of how to best interpret these residual signals.
릴리즈 노트
Adjusted cycle length보호된 스크립트입니다
이 스크립트는 비공개 소스로 게시됩니다. 하지만 이를 자유롭게 제한 없이 사용할 수 있습니다 – 자세한 내용은 여기에서 확인하세요.
면책사항
해당 정보와 게시물은 금융, 투자, 트레이딩 또는 기타 유형의 조언이나 권장 사항으로 간주되지 않으며, 트레이딩뷰에서 제공하거나 보증하는 것이 아닙니다. 자세한 내용은 이용 약관을 참조하세요.
면책사항
해당 정보와 게시물은 금융, 투자, 트레이딩 또는 기타 유형의 조언이나 권장 사항으로 간주되지 않으며, 트레이딩뷰에서 제공하거나 보증하는 것이 아닙니다. 자세한 내용은 이용 약관을 참조하세요.