PROTECTED SOURCE SCRIPT
업데이트됨 OBV Correlation [Fournier-Eaton]
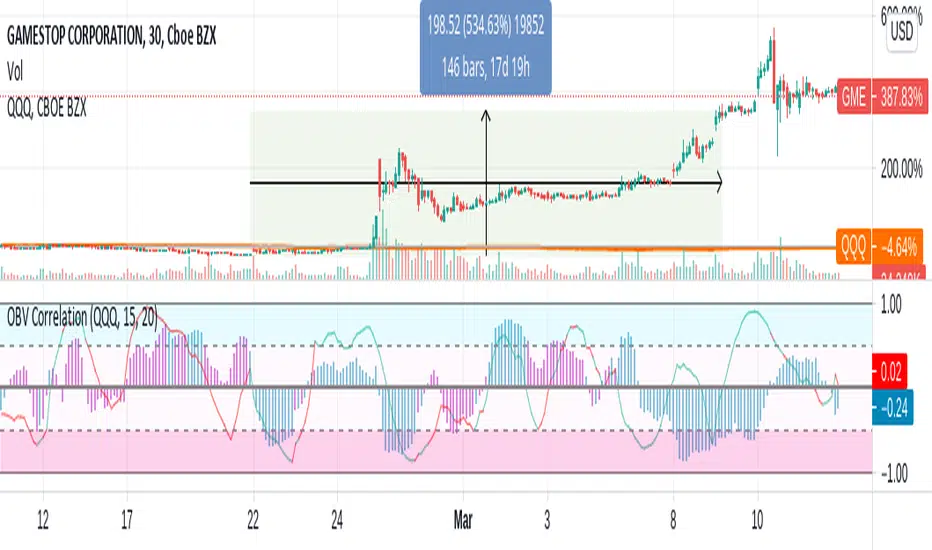
This is the On Balance Volume Correlation (And Price Correlation) Indicator. Directions of each has been encoded with color.
This Indicator is one of a series of scripts which I hope will aid in volume analysis.
If you find this at all useful, I'd love to hear from you.
Bradford Fournier-Eaton, PhD
This Indicator is one of a series of scripts which I hope will aid in volume analysis.
- The primary component is the histogram plot which represents the correlation between the direction of obv of your current equity and your chosen reference equity.
- I have included the direction of OBV for your currently plotted equity encoded as color. (Thus you know that if the plot is negative and blue, that the correlation is negative but the OBV for your current equity is increasing.)
- Furthermore, I included a supplementary price correlation line for the given equities. This line has had price direction encoded as color for quick reference.
- Thus as a quick example: if you see a blue negative histogram and an accompanying red positive line you know that: 1. obv is increasing and anti-correlated with your reference equity and the price is decreasing and positively correlated with your reference equity. A lot of information encoded in one plot.
If you find this at all useful, I'd love to hear from you.
Bradford Fournier-Eaton, PhD
릴리즈 노트
- UPDATE: obv length corrected to be independent of correlation length(s).
보호된 스크립트입니다
이 스크립트는 비공개 소스로 게시됩니다. 하지만 이를 자유롭게 제한 없이 사용할 수 있습니다 – 자세한 내용은 여기에서 확인하세요.
면책사항
해당 정보와 게시물은 금융, 투자, 트레이딩 또는 기타 유형의 조언이나 권장 사항으로 간주되지 않으며, 트레이딩뷰에서 제공하거나 보증하는 것이 아닙니다. 자세한 내용은 이용 약관을 참조하세요.
면책사항
해당 정보와 게시물은 금융, 투자, 트레이딩 또는 기타 유형의 조언이나 권장 사항으로 간주되지 않으며, 트레이딩뷰에서 제공하거나 보증하는 것이 아닙니다. 자세한 내용은 이용 약관을 참조하세요.