OPEN-SOURCE SCRIPT
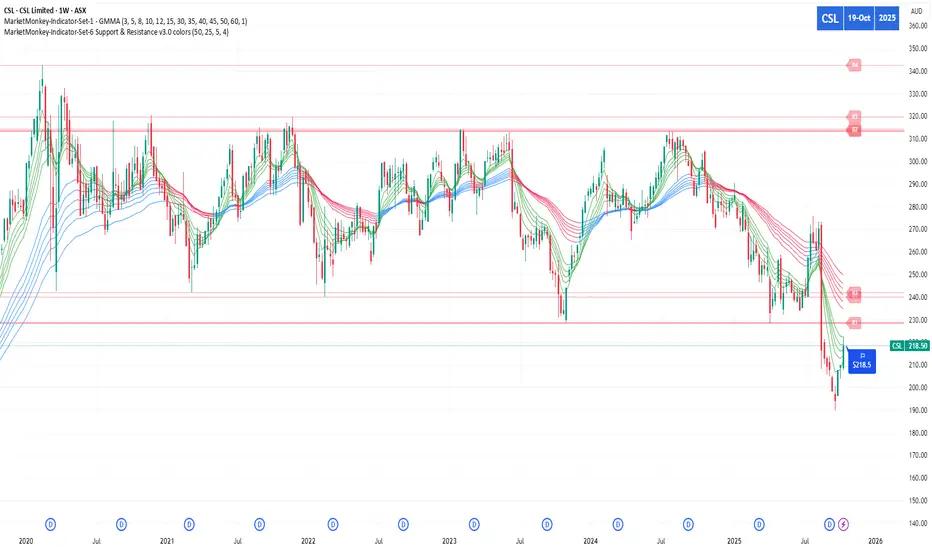
MarketMonkey-Indicator-Set-6 Support & Resistance v3.0 colors
MarketMonkey-Indicator-Set-6 Support & Resistance v3.0 colors
Automatically detects and plots up to four recent support and resistance levels using pivot highs and lows. Lines update dynamically with adaptive colours, highlighting key price zones in real time. Optional R1–R4 and S1–S4 labels keep charts clean yet informative. Ideal for identifying trend reversals, breakout points, and areas where buyers or sellers are likely to act.
________________________________________
🔍 What It Does
The script uses pivot highs and pivot lows to detect recent swing points — the moments where price has clearly turned.
• Resistance levels are drawn at recent pivot highs (red lines).
• Support levels are drawn at recent pivot lows (blue lines).
• Each level automatically updates as new price data forms, keeping your analysis current.
The indicator displays up to four recent resistance and support levels on each side (R1–R4, S1–S4), with labels and colours that adapt to whether the line is above or below current price.
________________________________________
🎨 Features
• Dynamic Detection: Automatically identifies and updates support and resistance using pivot logic.
• Multi-Level Display: Shows up to four most recent highs and lows for a broader market view.
• Customisable Inputs: Adjust the number of bars used to confirm pivots and control how many levels are displayed.
• Colour-Coded Clarity:
o Resistance lines = soft red tone (indicating potential ceiling levels).
o Support lines = soft blue tone (indicating price floors).
• Optional Labels: Toggle on/off “R1–R4” and “S1–S4” tags for quick reference.
• Strong Level Highlighting: The nearest (most recent) levels are drawn thicker for emphasis.
오픈 소스 스크립트
트레이딩뷰의 진정한 정신에 따라, 이 스크립트의 작성자는 이를 오픈소스로 공개하여 트레이더들이 기능을 검토하고 검증할 수 있도록 했습니다. 작성자에게 찬사를 보냅니다! 이 코드는 무료로 사용할 수 있지만, 코드를 재게시하는 경우 하우스 룰이 적용된다는 점을 기억하세요.
면책사항
해당 정보와 게시물은 금융, 투자, 트레이딩 또는 기타 유형의 조언이나 권장 사항으로 간주되지 않으며, 트레이딩뷰에서 제공하거나 보증하는 것이 아닙니다. 자세한 내용은 이용 약관을 참조하세요.
오픈 소스 스크립트
트레이딩뷰의 진정한 정신에 따라, 이 스크립트의 작성자는 이를 오픈소스로 공개하여 트레이더들이 기능을 검토하고 검증할 수 있도록 했습니다. 작성자에게 찬사를 보냅니다! 이 코드는 무료로 사용할 수 있지만, 코드를 재게시하는 경우 하우스 룰이 적용된다는 점을 기억하세요.
면책사항
해당 정보와 게시물은 금융, 투자, 트레이딩 또는 기타 유형의 조언이나 권장 사항으로 간주되지 않으며, 트레이딩뷰에서 제공하거나 보증하는 것이 아닙니다. 자세한 내용은 이용 약관을 참조하세요.