OPEN-SOURCE SCRIPT
CAPM Model with Returns Table
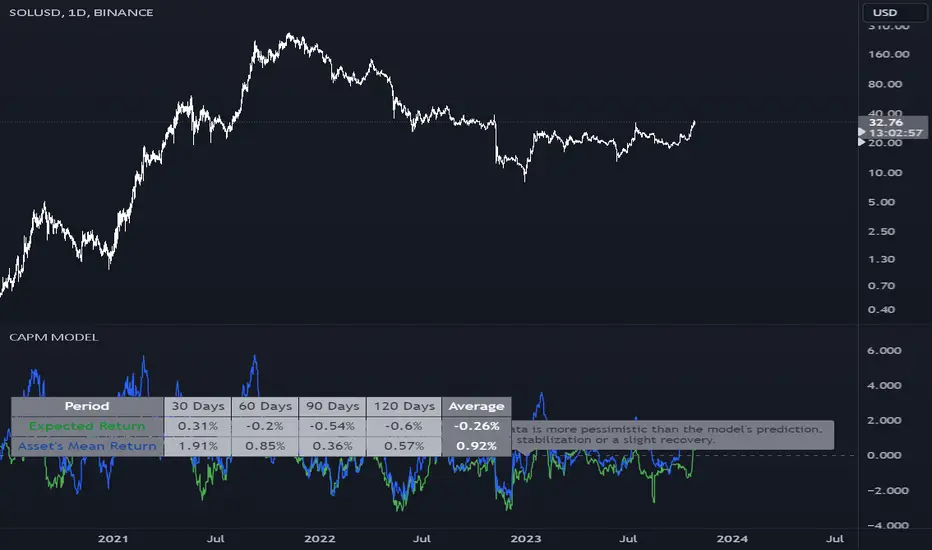
The given Pine Script is designed to implement the Capital Asset Pricing Model (CAPM) to calculate the expected return for a specified asset over various user-defined periods and compare it with the asset's historical mean return. The core features and functionalities of the script include:
Inputs:
Benchmark Symbol: Defaulted to "CRYPTOCAP:TOTAL". This serves as a comparison metric.
Risk-free Rate: Represents the return on an investment that is considered risk-free.
Benchmark Period: Used for plotting purposes. It doesn't affect table calculations.
Period Settings: Allows users to specify four different time periods for calculations.
Functionalities:
Computes daily returns for the benchmark and asset.
Calculates beta, which represents the volatility of the asset as compared to the volatility of the benchmark.
Uses CAPM to estimate expected returns over user-defined periods.
Generates a table displaying the expected return and asset's mean return for each period.
Provides implications based on the comparison between the expected returns and the asset's historical returns. This is showcased through a mutable label that is updated with each bar.
Visualization:
Plots expected return and asset's mean return over the benchmark period.
Provides a horizontal line to represent zero return.
Use Case:
This script can be helpful for traders or analysts looking to gauge the potential return of an asset compared to its historical performance using the CAPM. The implications provided by the script can serve as useful insights for making investment decisions. It's especially beneficial for those trading or analyzing assets in the cryptocurrency market, given the default benchmark setting.
Note: Before relying on this script for trading decisions, ensure a thorough understanding of its methodology and validate its assumptions against your research.
오픈 소스 스크립트
트레이딩뷰의 진정한 정신에 따라, 이 스크립트의 작성자는 이를 오픈소스로 공개하여 트레이더들이 기능을 검토하고 검증할 수 있도록 했습니다. 작성자에게 찬사를 보냅니다! 이 코드는 무료로 사용할 수 있지만, 코드를 재게시하는 경우 하우스 룰이 적용된다는 점을 기억하세요.
면책사항
해당 정보와 게시물은 금융, 투자, 트레이딩 또는 기타 유형의 조언이나 권장 사항으로 간주되지 않으며, 트레이딩뷰에서 제공하거나 보증하는 것이 아닙니다. 자세한 내용은 이용 약관을 참조하세요.
오픈 소스 스크립트
트레이딩뷰의 진정한 정신에 따라, 이 스크립트의 작성자는 이를 오픈소스로 공개하여 트레이더들이 기능을 검토하고 검증할 수 있도록 했습니다. 작성자에게 찬사를 보냅니다! 이 코드는 무료로 사용할 수 있지만, 코드를 재게시하는 경우 하우스 룰이 적용된다는 점을 기억하세요.
면책사항
해당 정보와 게시물은 금융, 투자, 트레이딩 또는 기타 유형의 조언이나 권장 사항으로 간주되지 않으며, 트레이딩뷰에서 제공하거나 보증하는 것이 아닙니다. 자세한 내용은 이용 약관을 참조하세요.