OPEN-SOURCE SCRIPT
업데이트됨 F.B_Consolidation Range Identifier
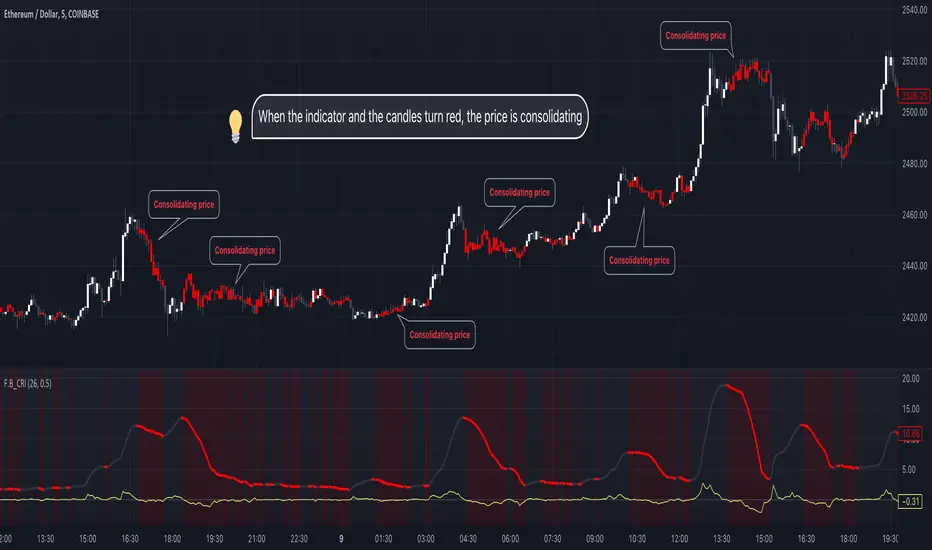
The "F.B_Consolidation Range Identifier" (F.B_CRI) is an indicator aimed at identifying consolidation areas in the price chart. Here is an explanation of the logic and usage of this indicator:
Calculation of Standard Deviation
This indicator analyzes the market's volatility by considering the standard deviation of price movements over a defined period. A higher standard deviation indicates larger price movement, while a lower standard deviation suggests potential consolidation, where price movements are limited.
Derivation of Standard Deviation
To track changes in volatility, the derivative of the standard deviation is calculated. Positive derivative values indicate increasing volatility, while negative values suggest a decrease in volatility. This allows for the identification of potential consolidation phases where volatility decreases, and the market may stabilize.
Identification of Consolidation Phase
The indicator signals potential consolidation phases when the standard deviation is low and/or the derivative of the standard deviation is negative. To represent consolidation phases on the chart, the standard deviation line, background, and candles are colored red. However, it's important to note that the display is customizable and can be configured according to individual needs.
🚨 Important 🚨
The indicator only indicates whether consolidation phases exist. If the standard deviation line, background, or candles are gray, it indicates that a trend exists in general, but not whether it is bullish or bearish. It is advisable to use other analytical tools to confirm the direction of the trend.
릴리즈 노트
Timeframe selection in settings오픈 소스 스크립트
트레이딩뷰의 진정한 정신에 따라, 이 스크립트의 작성자는 이를 오픈소스로 공개하여 트레이더들이 기능을 검토하고 검증할 수 있도록 했습니다. 작성자에게 찬사를 보냅니다! 이 코드는 무료로 사용할 수 있지만, 코드를 재게시하는 경우 하우스 룰이 적용된다는 점을 기억하세요.
면책사항
해당 정보와 게시물은 금융, 투자, 트레이딩 또는 기타 유형의 조언이나 권장 사항으로 간주되지 않으며, 트레이딩뷰에서 제공하거나 보증하는 것이 아닙니다. 자세한 내용은 이용 약관을 참조하세요.
오픈 소스 스크립트
트레이딩뷰의 진정한 정신에 따라, 이 스크립트의 작성자는 이를 오픈소스로 공개하여 트레이더들이 기능을 검토하고 검증할 수 있도록 했습니다. 작성자에게 찬사를 보냅니다! 이 코드는 무료로 사용할 수 있지만, 코드를 재게시하는 경우 하우스 룰이 적용된다는 점을 기억하세요.
면책사항
해당 정보와 게시물은 금융, 투자, 트레이딩 또는 기타 유형의 조언이나 권장 사항으로 간주되지 않으며, 트레이딩뷰에서 제공하거나 보증하는 것이 아닙니다. 자세한 내용은 이용 약관을 참조하세요.