OPEN-SOURCE SCRIPT
업데이트됨 Recent High/Low Dots by Alejandro P
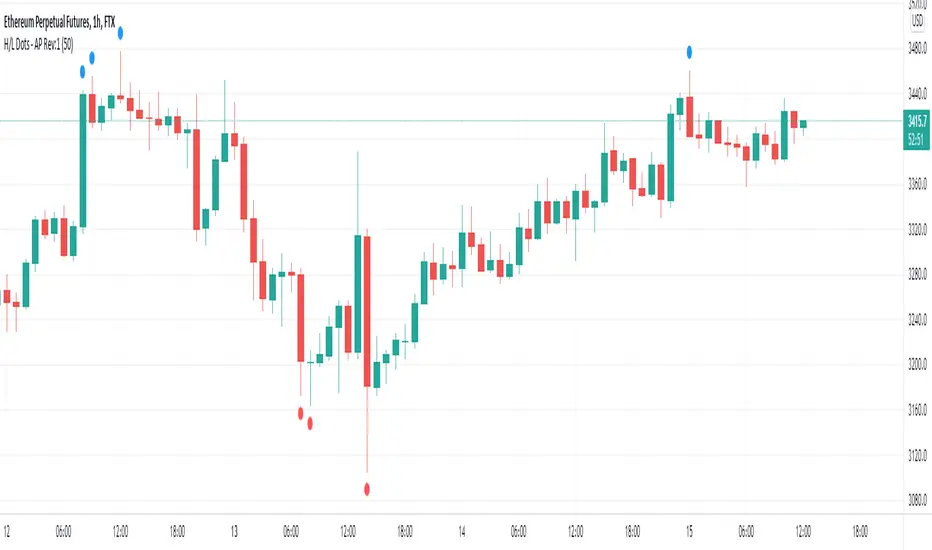
Simple indicator that plots a dot in the chart when a candle breaks the high of the past X candles.
This is useful to easily visualize when the market is coming out of a range and making fresh highs or lows relative to the past X candles.
It can be used in trend following systems as an additional filter for validation.
This is useful to easily visualize when the market is coming out of a range and making fresh highs or lows relative to the past X candles.
It can be used in trend following systems as an additional filter for validation.
릴리즈 노트
Updated to pinescript 5 and added alert conditions for easy alert creation릴리즈 노트
Corrected allertcondition so it now actually triggers.오픈 소스 스크립트
트레이딩뷰의 진정한 정신에 따라, 이 스크립트의 작성자는 이를 오픈소스로 공개하여 트레이더들이 기능을 검토하고 검증할 수 있도록 했습니다. 작성자에게 찬사를 보냅니다! 이 코드는 무료로 사용할 수 있지만, 코드를 재게시하는 경우 하우스 룰이 적용된다는 점을 기억하세요.
면책사항
해당 정보와 게시물은 금융, 투자, 트레이딩 또는 기타 유형의 조언이나 권장 사항으로 간주되지 않으며, 트레이딩뷰에서 제공하거나 보증하는 것이 아닙니다. 자세한 내용은 이용 약관을 참조하세요.
오픈 소스 스크립트
트레이딩뷰의 진정한 정신에 따라, 이 스크립트의 작성자는 이를 오픈소스로 공개하여 트레이더들이 기능을 검토하고 검증할 수 있도록 했습니다. 작성자에게 찬사를 보냅니다! 이 코드는 무료로 사용할 수 있지만, 코드를 재게시하는 경우 하우스 룰이 적용된다는 점을 기억하세요.
면책사항
해당 정보와 게시물은 금융, 투자, 트레이딩 또는 기타 유형의 조언이나 권장 사항으로 간주되지 않으며, 트레이딩뷰에서 제공하거나 보증하는 것이 아닙니다. 자세한 내용은 이용 약관을 참조하세요.