INVITE-ONLY SCRIPT
[SignalFI] DynaPIV Trend
Welcome!
We're pleased to introduce DynaPIV Trend! This single script provides a array of valuable trend information that can help in short term scalping strategies, and helping define trend strength across support and resistance points.
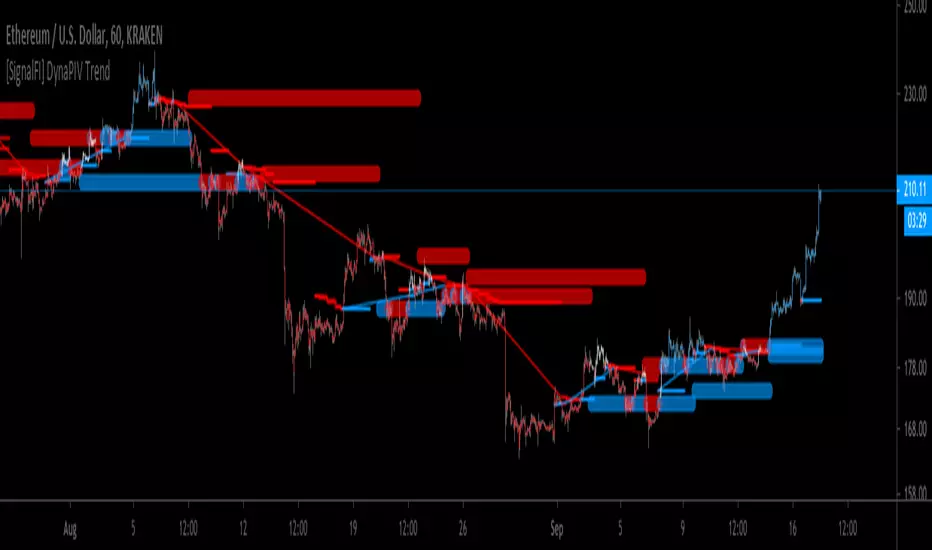
The heart of DynaPIV is an dynamic, volatility adjusted moving average based on fibonacci ratios. The script creates a visual representation of trend based on the pivots created with this dynamic moving average as has both short and long term support and resistance lines delineated by color and thickness.
In general, the script will color bars according to the trend. By default, our safe mode is enabled which will filter out potential false breakouts, as well identify channeling zones (where bars are white). Disabling Safe Mode will provide more opportunities for scalping, however increases the risk of trend invalidation. By nature the trader is meant to follow the comprehensive visual presented by DynaPIV Trend, inclusive of horizontal and diagonal painted support and resistance lines.
NOTE: The script is useful for timeframes 5M to 2HR. However the recommended is 30M - 1HR. Using the script on higher timeframes will invalidate the dynamic nature of the DynaPIV Trend volatility calculation and thus render the trend invalid.
SignalFI was created to help traders and investors to effectively analyze the market based on the Golden Mean Ratio (Fibonacci numbers), plan a trade and ultimately execute it. To help inform and educate market decisions we developed a set of Trading Indicators which are available on TradingView.
SignalFI indicators are just that, indicators. Our indicators are generally configured to use completely historical data (negating repaint), and we advise all alerts created with SignalFI indicators to be fired upon "close" of the current candle. Our indicators can provide valuable context and visualization support when performing market analysis and executing buy and sell decisions. However. we are not financial experts, and all information presented on this site or our other media outlets are for educational purposes only.
For subscription information, visit signalfi.net and follow us on twitter: @signalfi_
We're pleased to introduce DynaPIV Trend! This single script provides a array of valuable trend information that can help in short term scalping strategies, and helping define trend strength across support and resistance points.
The heart of DynaPIV is an dynamic, volatility adjusted moving average based on fibonacci ratios. The script creates a visual representation of trend based on the pivots created with this dynamic moving average as has both short and long term support and resistance lines delineated by color and thickness.
In general, the script will color bars according to the trend. By default, our safe mode is enabled which will filter out potential false breakouts, as well identify channeling zones (where bars are white). Disabling Safe Mode will provide more opportunities for scalping, however increases the risk of trend invalidation. By nature the trader is meant to follow the comprehensive visual presented by DynaPIV Trend, inclusive of horizontal and diagonal painted support and resistance lines.
NOTE: The script is useful for timeframes 5M to 2HR. However the recommended is 30M - 1HR. Using the script on higher timeframes will invalidate the dynamic nature of the DynaPIV Trend volatility calculation and thus render the trend invalid.
SignalFI was created to help traders and investors to effectively analyze the market based on the Golden Mean Ratio (Fibonacci numbers), plan a trade and ultimately execute it. To help inform and educate market decisions we developed a set of Trading Indicators which are available on TradingView.
SignalFI indicators are just that, indicators. Our indicators are generally configured to use completely historical data (negating repaint), and we advise all alerts created with SignalFI indicators to be fired upon "close" of the current candle. Our indicators can provide valuable context and visualization support when performing market analysis and executing buy and sell decisions. However. we are not financial experts, and all information presented on this site or our other media outlets are for educational purposes only.
For subscription information, visit signalfi.net and follow us on twitter: @signalfi_
초대 전용 스크립트
이 스크립트는 작성자가 승인한 사용자만 접근할 수 있습니다. 사용하려면 요청 후 승인을 받아야 하며, 일반적으로 결제 후에 허가가 부여됩니다. 자세한 내용은 아래 작성자의 안내를 따르거나 SignalFi에게 직접 문의하세요.
트레이딩뷰는 스크립트의 작동 방식을 충분히 이해하고 작성자를 완전히 신뢰하지 않는 이상, 해당 스크립트에 비용을 지불하거나 사용하는 것을 권장하지 않습니다. 커뮤니티 스크립트에서 무료 오픈소스 대안을 찾아보실 수도 있습니다.
작성자 지시 사항
SignalFi is creating cutting edge TradingView scripts to help identify rogue market Alpha. Check out signalfi.net for subscription information and @signalfi_ on Twitter for updates.
면책사항
해당 정보와 게시물은 금융, 투자, 트레이딩 또는 기타 유형의 조언이나 권장 사항으로 간주되지 않으며, 트레이딩뷰에서 제공하거나 보증하는 것이 아닙니다. 자세한 내용은 이용 약관을 참조하세요.