PROTECTED SOURCE SCRIPT
COT Index + COT Report + Valuation Tool + Seasonality
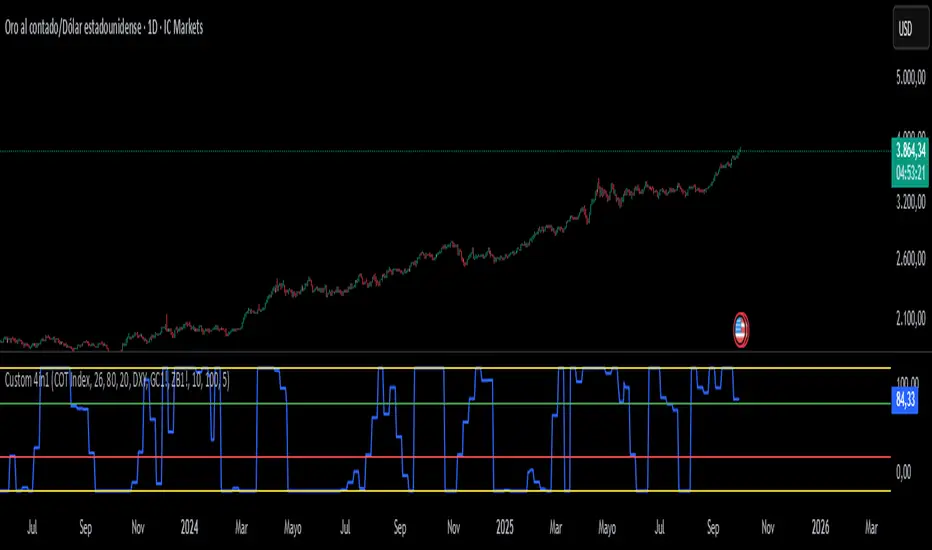
This powerful 4-in-1 indicator was designed for traders and analysts seeking a competitive edge by delving deeper into the market's layers. Instead of cluttering your chart with multiple scripts, this tool integrates four fundamental analyses into a single window, selectable via a simple dropdown menu.
What tools are included?
1. COT Index (Commitment of Traders Index):
An oscillator that normalizes data from the COT report to show the extreme positioning of large traders (Commercials, Large Speculators). It's ideal for identifying "overbought" or "oversold" conditions in market sentiment and anticipating potential price reversals.
2. COT Report (Commitment of Traders Report):
This shows the net positions (longs vs. shorts) of traders in their raw values. Unlike the index, this tool allows you to see the actual magnitude of the positioning and how it evolves, serving as an excellent trend confirmation.
3. Valuation Tool:
A relative value indicator that compares the performance of the current asset against three other key symbols (by default: DXY, Gold, and Bonds). It helps you visually determine if an asset is overvalued or undervalued in relation to the broader market, offering a unique perspective for your trades.
4. Seasonality:
Plots the average historical price pattern of the asset for a configurable number of years. This tool provides you with a "roadmap" of seasonal tendencies, allowing you to identify if the current price aligns with its historical behavior for a specific time of year.
How to use it?
1. Add the indicator to your chart.
2. Go to the indicator's settings (the ⚙️ gear icon).
3. In the "Choose Indicator to Display" dropdown menu, select the tool you want to view.
4. To see multiple tools at once, simply add the indicator to the chart multiple times and choose a different tool in each panel.
This indicator is ideal for swing traders, position traders, and macro analysts who wish to supplement their technical analysis with high-quality fundamental data.
보호된 스크립트입니다
이 스크립트는 비공개 소스로 게시됩니다. 하지만 제한 없이 자유롭게 사용할 수 있습니다 — 여기에서 자세히 알아보기.
면책사항
이 정보와 게시물은 TradingView에서 제공하거나 보증하는 금융, 투자, 거래 또는 기타 유형의 조언이나 권고 사항을 의미하거나 구성하지 않습니다. 자세한 내용은 이용 약관을 참고하세요.
보호된 스크립트입니다
이 스크립트는 비공개 소스로 게시됩니다. 하지만 제한 없이 자유롭게 사용할 수 있습니다 — 여기에서 자세히 알아보기.
면책사항
이 정보와 게시물은 TradingView에서 제공하거나 보증하는 금융, 투자, 거래 또는 기타 유형의 조언이나 권고 사항을 의미하거나 구성하지 않습니다. 자세한 내용은 이용 약관을 참고하세요.