PROTECTED SOURCE SCRIPT
Yield curve indicator trial
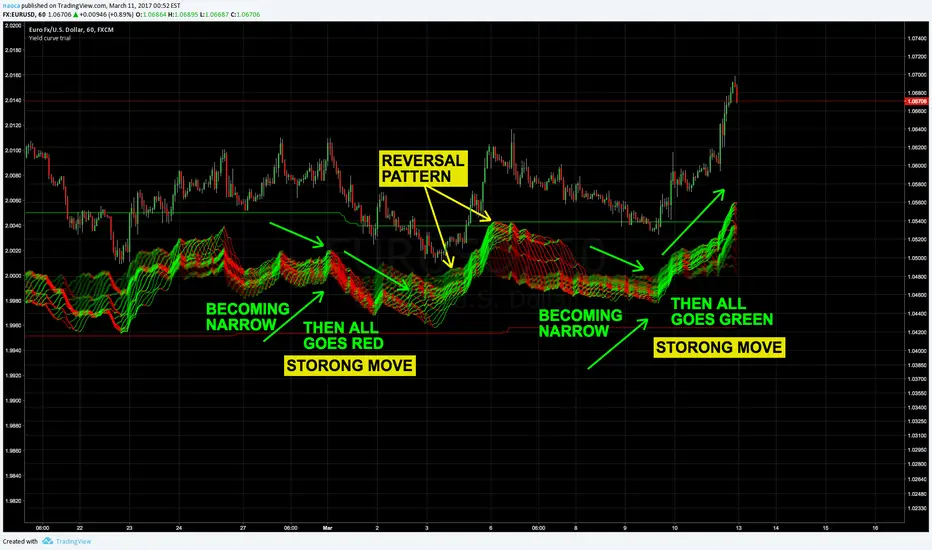
This indicator shows the multiple time frame yield curves of chart.
It’s useful to understand how much good or bad is the performance for short-term & long-term traders.
Near side of lines indicates longer term yield.
And far side of lines indicates shorter term of yield.
While it’s ascending, its color is green & if not it will be red.
- - - - - - - - - - - - - - - - - - - - - - - - - - - - - -
This is trial version. You can check how it works on any chart!
* Data before March. 17th, 2017 can be shown.
More information:
tradeindicator.tumblr.com/post/158257399947/yield-curve-indicator
tradeindicator.tumblr.com/
보호된 스크립트입니다
이 스크립트는 비공개 소스로 게시됩니다. 하지만 이를 자유롭게 제한 없이 사용할 수 있습니다 – 자세한 내용은 여기에서 확인하세요.
면책사항
해당 정보와 게시물은 금융, 투자, 트레이딩 또는 기타 유형의 조언이나 권장 사항으로 간주되지 않으며, 트레이딩뷰에서 제공하거나 보증하는 것이 아닙니다. 자세한 내용은 이용 약관을 참조하세요.
면책사항
해당 정보와 게시물은 금융, 투자, 트레이딩 또는 기타 유형의 조언이나 권장 사항으로 간주되지 않으며, 트레이딩뷰에서 제공하거나 보증하는 것이 아닙니다. 자세한 내용은 이용 약관을 참조하세요.