PROTECTED SOURCE SCRIPT
Price Grid (Base/Step/Levels)
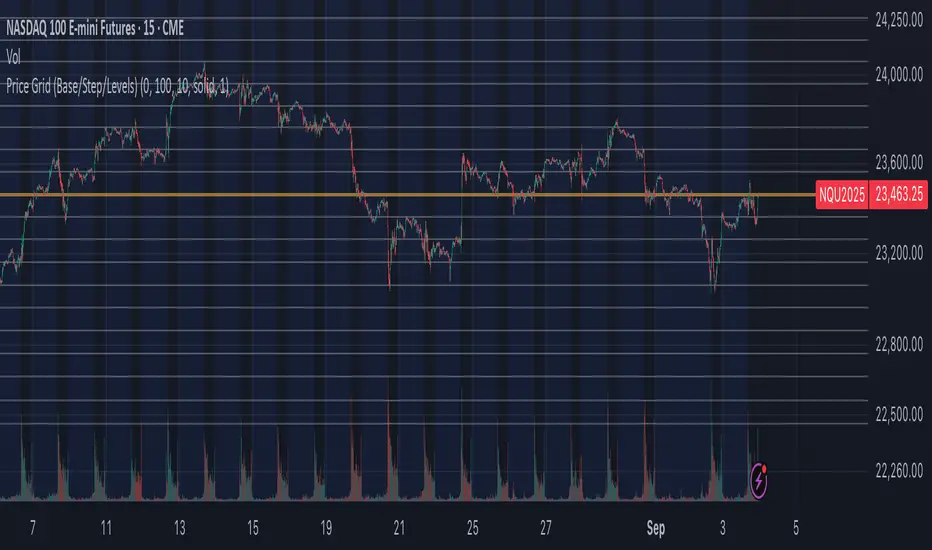
Price Grid (Base/Step/Levels) is a simple yet powerful tool for visual traders. It automatically draws a customizable grid of horizontal price levels on your chart.
You choose a base price, a grid step size, and the number of levels to display above and below. The indicator then plots evenly spaced lines around the base, helping you:
Spot round-number zones and psychological levels
Plan entries, exits, and stop-loss placements
Visualize support/resistance clusters
Build grid or ladder trading strategies
The base line is highlighted so you always know your anchor level, while the other levels are styled separately for clarity.
⚙️ Inputs
Base price → anchor level (set 0 to use current close price)
Grid step → distance between levels
Number of levels → lines drawn above & below base
Line style / width / colors → full customization
✅ Notes
Works on any market and timeframe
Automatically respects the symbol’s minimum tick size
Lightweight & non-repainting
보호된 스크립트입니다
이 스크립트는 비공개 소스로 게시됩니다. 하지만 이를 자유롭게 제한 없이 사용할 수 있습니다 – 자세한 내용은 여기에서 확인하세요.
면책사항
해당 정보와 게시물은 금융, 투자, 트레이딩 또는 기타 유형의 조언이나 권장 사항으로 간주되지 않으며, 트레이딩뷰에서 제공하거나 보증하는 것이 아닙니다. 자세한 내용은 이용 약관을 참조하세요.
면책사항
해당 정보와 게시물은 금융, 투자, 트레이딩 또는 기타 유형의 조언이나 권장 사항으로 간주되지 않으며, 트레이딩뷰에서 제공하거나 보증하는 것이 아닙니다. 자세한 내용은 이용 약관을 참조하세요.