OPEN-SOURCE SCRIPT
Heikin Ashi ROC Percentile Strategy
**User Guide for the "Heikin Ashi ROC Percentile Strategy"**
This strategy, "Heikin Ashi ROC Percentile Strategy", is designed to provide an easy-to-use framework for trading based on the Heikin Ashi Rate of Change (ROC) and its percentiles.
Here's how you can use it:
1. **Setting the Start Date**: You can set the start date for the strategy in the user inputs at the top of the script. The variable `startDate` defines the point from which the script begins executing trades. Simply input the desired date in the format "YYYY MM DD". For example, to start the strategy from March 3, 2023, you would enter `startDate = timestamp("2023 03 03")`.
2. **Adjusting the Midline, Lookback Period, and Stop Loss Level**: The `zerohLine`, `rocLength`, and `stopLossLevel` inputs allow you to adjust the baseline for ROC, the lookback period for the SMA and ROC, and the level at which the strategy stops the loss, respectively. By tweaking these parameters, you can fine-tune the strategy to better suit your trading style or the particular characteristics of the asset you are trading.
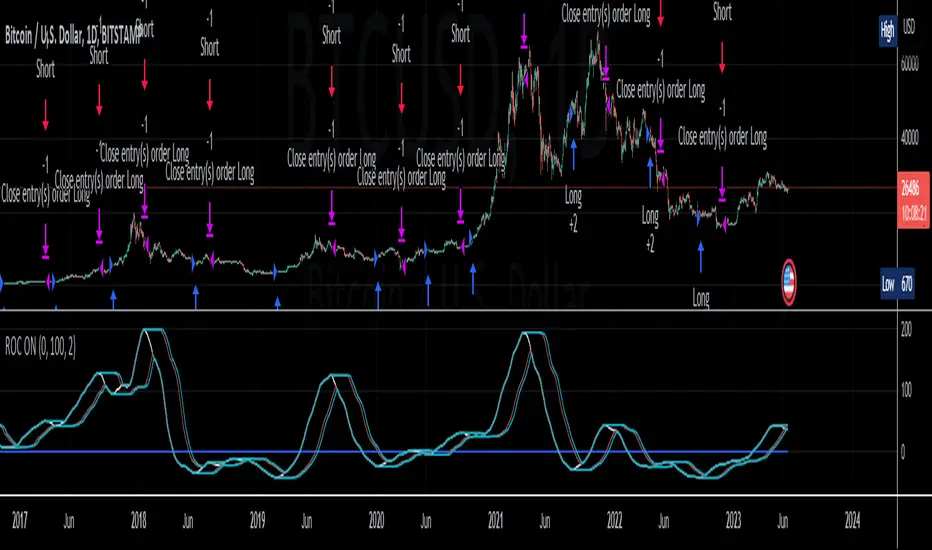
3. **Understanding the Trade Conditions**: The script defines conditions for entering and exiting long and short positions based on crossovers and crossunders of the ROC and the upper and lower "kill lines". These lines are defined as certain percentiles of the ROC's highest and lowest values over a specified lookback period. When the ROC crosses above the lower kill line, the script enters a long position; when it crosses below the upper kill line, it exits the position. Similarly, when the ROC crosses below the upper kill line, the script enters a short position; when it crosses above the lower kill line, it exits the position.
In my testing, this strategy performed best on a day and hour basis. However, I encourage you to experiment with different timeframes and settings to see how the strategy performs under various conditions. Remember, there's no one-size-fits-all approach to trading; what works best will depend on your specific circumstances, goals, and risk tolerance.
If you find other useful applications for this strategy, please let me know in the comments. Your feedback is invaluable in helping to refine and improve this tool. Happy trading!
This strategy, "Heikin Ashi ROC Percentile Strategy", is designed to provide an easy-to-use framework for trading based on the Heikin Ashi Rate of Change (ROC) and its percentiles.
Here's how you can use it:
1. **Setting the Start Date**: You can set the start date for the strategy in the user inputs at the top of the script. The variable `startDate` defines the point from which the script begins executing trades. Simply input the desired date in the format "YYYY MM DD". For example, to start the strategy from March 3, 2023, you would enter `startDate = timestamp("2023 03 03")`.
2. **Adjusting the Midline, Lookback Period, and Stop Loss Level**: The `zerohLine`, `rocLength`, and `stopLossLevel` inputs allow you to adjust the baseline for ROC, the lookback period for the SMA and ROC, and the level at which the strategy stops the loss, respectively. By tweaking these parameters, you can fine-tune the strategy to better suit your trading style or the particular characteristics of the asset you are trading.
3. **Understanding the Trade Conditions**: The script defines conditions for entering and exiting long and short positions based on crossovers and crossunders of the ROC and the upper and lower "kill lines". These lines are defined as certain percentiles of the ROC's highest and lowest values over a specified lookback period. When the ROC crosses above the lower kill line, the script enters a long position; when it crosses below the upper kill line, it exits the position. Similarly, when the ROC crosses below the upper kill line, the script enters a short position; when it crosses above the lower kill line, it exits the position.
In my testing, this strategy performed best on a day and hour basis. However, I encourage you to experiment with different timeframes and settings to see how the strategy performs under various conditions. Remember, there's no one-size-fits-all approach to trading; what works best will depend on your specific circumstances, goals, and risk tolerance.
If you find other useful applications for this strategy, please let me know in the comments. Your feedback is invaluable in helping to refine and improve this tool. Happy trading!
오픈 소스 스크립트
트레이딩뷰의 진정한 정신에 따라, 이 스크립트의 작성자는 이를 오픈소스로 공개하여 트레이더들이 기능을 검토하고 검증할 수 있도록 했습니다. 작성자에게 찬사를 보냅니다! 이 코드는 무료로 사용할 수 있지만, 코드를 재게시하는 경우 하우스 룰이 적용된다는 점을 기억하세요.
면책사항
해당 정보와 게시물은 금융, 투자, 트레이딩 또는 기타 유형의 조언이나 권장 사항으로 간주되지 않으며, 트레이딩뷰에서 제공하거나 보증하는 것이 아닙니다. 자세한 내용은 이용 약관을 참조하세요.
오픈 소스 스크립트
트레이딩뷰의 진정한 정신에 따라, 이 스크립트의 작성자는 이를 오픈소스로 공개하여 트레이더들이 기능을 검토하고 검증할 수 있도록 했습니다. 작성자에게 찬사를 보냅니다! 이 코드는 무료로 사용할 수 있지만, 코드를 재게시하는 경우 하우스 룰이 적용된다는 점을 기억하세요.
면책사항
해당 정보와 게시물은 금융, 투자, 트레이딩 또는 기타 유형의 조언이나 권장 사항으로 간주되지 않으며, 트레이딩뷰에서 제공하거나 보증하는 것이 아닙니다. 자세한 내용은 이용 약관을 참조하세요.