OPEN-SOURCE SCRIPT
RAHUL ATR + Volume Spikes
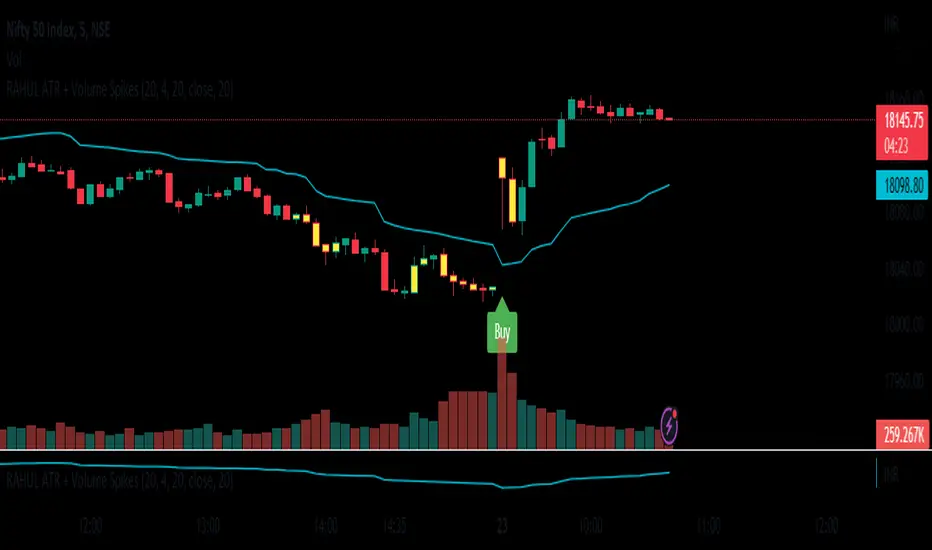
New Volume Spikes Strategy.
The Average True Range (ATR) indicator is a technical analysis tool that measures the volatility of an asset. It can be used to create a trading strategy by identifying periods of high volatility and making trades based on those conditions.
Here is an example of a simple ATR trading strategy:
Calculate the ATR for the asset you are trading. This can typically be done using a charting platform or software.
Identify the average ATR over a period of time (such as 14 days). This will be your "threshold" for determining high volatility.
When the current ATR is above the threshold, enter a long position (buy) in the asset.
When the current ATR is below the threshold, exit the long position (sell) and wait for the next period of high volatility.
Repeat the process for the next period of time.
This is a basic example of an ATR strategy and can be adjusted as per one's preference, you can add other indicators or market conditions to filter out trades and also use different time frame to check the ATR values. ATR can also be used in combination with other indicators and strategies to improve the accuracy of your trades.
It's always important to backtest any strategy before actually trading with real money, and also to consider the risk management, stop loss and profit taking levels, and adjust the strategy accordingly
오픈 소스 스크립트
트레이딩뷰의 진정한 정신에 따라, 이 스크립트의 작성자는 이를 오픈소스로 공개하여 트레이더들이 기능을 검토하고 검증할 수 있도록 했습니다. 작성자에게 찬사를 보냅니다! 이 코드는 무료로 사용할 수 있지만, 코드를 재게시하는 경우 하우스 룰이 적용된다는 점을 기억하세요.
면책사항
해당 정보와 게시물은 금융, 투자, 트레이딩 또는 기타 유형의 조언이나 권장 사항으로 간주되지 않으며, 트레이딩뷰에서 제공하거나 보증하는 것이 아닙니다. 자세한 내용은 이용 약관을 참조하세요.
오픈 소스 스크립트
트레이딩뷰의 진정한 정신에 따라, 이 스크립트의 작성자는 이를 오픈소스로 공개하여 트레이더들이 기능을 검토하고 검증할 수 있도록 했습니다. 작성자에게 찬사를 보냅니다! 이 코드는 무료로 사용할 수 있지만, 코드를 재게시하는 경우 하우스 룰이 적용된다는 점을 기억하세요.
면책사항
해당 정보와 게시물은 금융, 투자, 트레이딩 또는 기타 유형의 조언이나 권장 사항으로 간주되지 않으며, 트레이딩뷰에서 제공하거나 보증하는 것이 아닙니다. 자세한 내용은 이용 약관을 참조하세요.